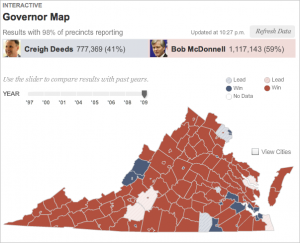
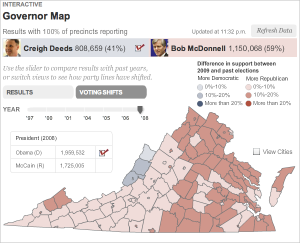
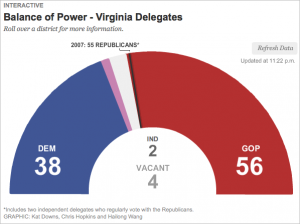
I worked on two graphics for the recent election in Virginia — a map that shows the results of the 2009 governor’s race and election results back to ’97, and a delegates meter showing the balance of power in the VA House of Delegates.

The governor map showed live results throughout the night, and at the end of the night historical results showed up as well, so that users could look at how voting patterns have shifted since previous elections. I think this was really interesting given the speculation about how the 2008 presidential election might impact this year’s race in Virginia.

The delegates meter was a quick piece, I just used some circle drawing math in AS3 to create 100 segments in a half-circle, and fill them in as the results came in. When you roll over the segments, you see current results for that district.

I made small versions of these graphics to go on our local homepage on Tuesday night and Wednesday morning. They were simplified versions that linked out to the full graphics. I think that was a smart way to push traffic to our graphics on election night, while giving casual viewers a current tally of results.
