Say What? Interactive transcript player tool is a new way to tell speech stories

Ryan speech

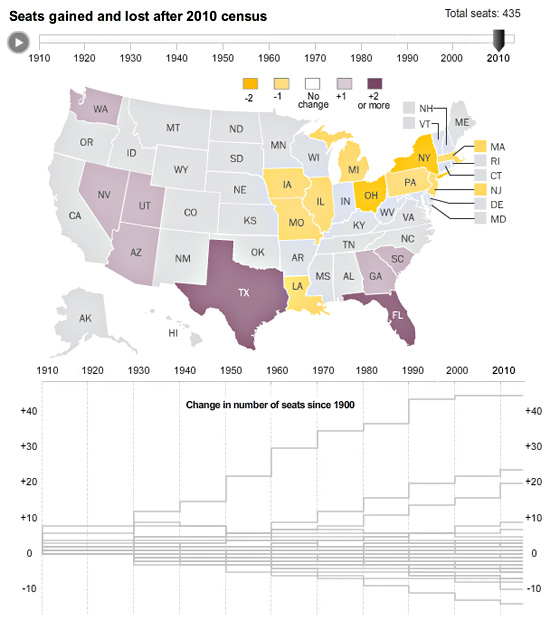
Yesterday, we launched a new project: an interactive transcript player that matches up the words of the speech, Post analysis, and reaction from Twitter.

I have been wanting to do a Twitter project for a while, and this time all the pieces fit together. After I pitched the idea, Cory Haik coordinated a partnership with VoterTide, a great company in Omaha that does aggregation and analysis of Twitter trends specifically around politics, that made the Twitter analysis segment possible. I designed the piece, and we were able to get two awesome developers, Leslie Passante and Jeremy Bowers, to build it.

My favorite things are the ‘watch highlights’ view, where you can see all the Post analysis and skip everything else, and the addition of the social layer. Here’s an excerpt from the ‘Ask the Post’ blog post we put together on it:

… VoterTide will provide user reactions as they happen on Twitter, and we’ll match that to the moment in time these reactions occurred during the speech. We will package these reactions to reveal insights into the nation’s response to the conventions and their most-watched speeches.

We’ve gotten some great reaction from this project on washingtonpost.com and on Twitter. It was also written up by Poynter:

So as the GOP nominee took to the podium and the president prepares to do the same at next week’s DNC, it is appropriate that journalists roll out the coolest newest thing. The Washington Post did just that.

“Some innovations we have done, you step back and say, ‘That was fun.’ And some you might say, ‘We produced a new story form.’ But this time I think we can say both,” Haik said.

Totally agree! And we just did another one for Mitt Romney’s speech. This project would not be possible without the awesome producers who put it together: Haley Crum and Mary Keister. Check it out!

How does your income compare?

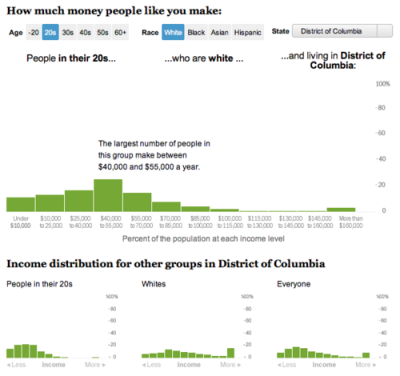
In an extremely quick turnaround, I worked with Dan Keating to create this tool that shows you the breakdown of what other people of your age, race, and location make each year. Hopefully in the future we’ll be able to improve it and add some more metrics, but it’s pretty cool for taking less than a day!

Royal rumors (and some graphics fun)

With Kate and Will back in the news for the rumors about a pregnancy with twins (not true, by the way), I thought, “Hey, what better opportunity to make up for the fact that I never wrote about our royal wedding graphics on the blog?” So here I am. Royal couple junkies, enjoy. And if you’re a true royal wedding fanatic, you might enjoy this video about my roommate, coincidentally also named Kate Middleton (this one is true).

The main piece I worked on was the Westminster Abbey and parade route tour. Sohail Al-Jamea and Alberto Cuadra worked together on the 3-D renderings and animations, and I layered on the interactivity and created the Google Earth flyovers and, with help from Laris Karklis, the parade route maps and Street View layers.

Continue to see how we made the interactive parade route, and how we created 3 types of javascript quizzes »

Analyzing the U.S. tax code, break by break, and other recent charts

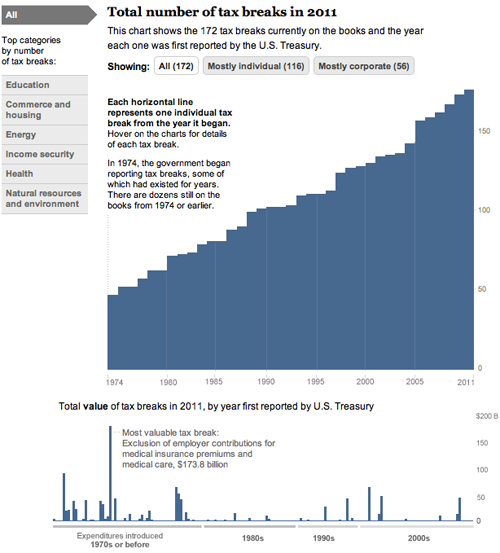
Today, we came out with a new graphic that looks at the tax breaks on the books this year. It is part of Running in the Red, a series the Post has been running for the past few months, and accompanied Lori Montgomery’s front-page story, “Ever-increasing tax breaks for U.S. families eclipse benefits for special interests,” a great story that explains spending through the tax code.

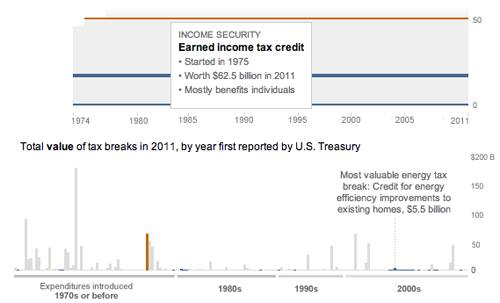
The graphic is all CSS and JavaScript. With charts that only have bars, it’s simple to dynamically add sized divs with background colors that create charts. The data will update automatically if necessary and it works across all browsers and mobile platforms with no workarounds:

And has details for each of the 172 breaks currently active (see below). Added bonus: I learned a ton about the tax code.

And a couple more (relatively) recent charts:

This one I worked on with Alicia Parlapiano and Neil Irwin. Because I wanted to create animate transitions and interactivity, I used Flash to create this graphic. It has detailed drilldowns to look at employment in each sector of the economy. I tried to inject more annotation into this graphic (and the taxes one above) than we have done in the past with data-driven graphics. Instead of throwing a bunch of data out there, we’re providing more context and guided views — by category and by sector versus a completely self-guided data dive.

This was a fun chart I helped our intern, Heather Billings, with at the beginning of the summer. We used flot to make these charts showing how the lead changed between the Heat and the Mavericks during the NBA finals. This was particularly fun for me because I got really into the NBA finals this year and watched every game. I know, hard to believe, but true. I was a having a great time analyzing the outcome of the games and reading all the news — and if you missed it, this was a great article from Bill Simmons at Grantland.

And another one about when and if China’s economy will pass the United States to become the world’s largest.

Mapping the news: Libya and Japan

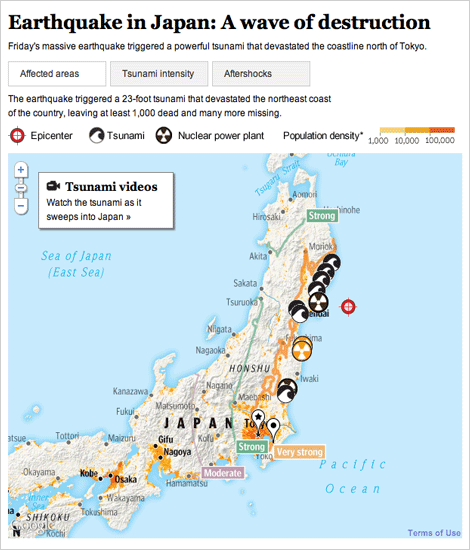
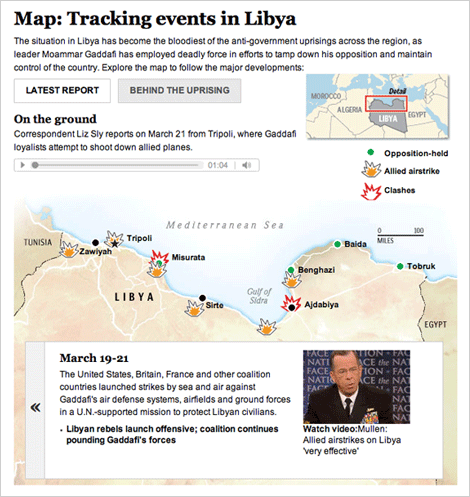
The past several weeks have been full of foreign news, and we have been producing lots of graphics to explain what’s happening. I have worked on these two graphics, one about the earthquake and subsequent tsunami in Japan, and one that explains what is going on in Libya.

For a full explanation of the process of creating the Japan graphic, visit the new Innovations blog at the WP (excerpted below):

Friday morning, as news of the earthquake in Japan spread, we started pulling together an interactive map that would show readers where and how events unfolded. Over the next 36 hours, we would continually expand and improve the information, design and interactivity of the map as the news of the earthquake and tsunami came in. Read more »

For Libya, we combined an event tracker with audio and video from the ground. The reports from correspondents on the ground is my favorite part.

Both graphics are done using javascript and jquery, so check them out on your tablet devices!

Creating Live Election Results Maps

Live Results: House

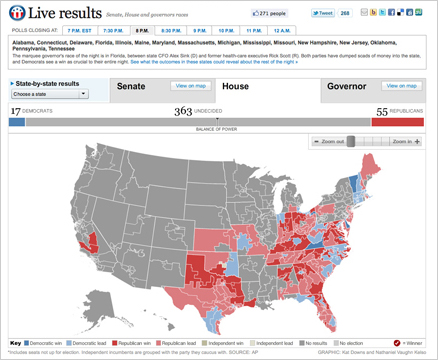
On Nov. 2, midterm election day, we put up these maps that tracked the results as they came in. For Senate and Governors we had state and county-level data, and we had House districts as well. This suite of maps was published in The Washington Post, as well as on Yahoo! News and the Telegraph (UK). The maps have balance of power charting and tabular results as well as zooming and deep linking features. Read more about how we built the maps »

The Cost of War

TBI Menu

This past Sunday “Coming home a different person” launched, a project I worked on with Whitney Shefte and Alberto Cuadra, alongside reporter Chris Davenport. It features an overview video that covers the increases in traumatic brain injury cases and what doctors are doing to treat it, as well as five case studies of three soldiers and two Marines, and a graphic that explains the science of brain injury.

I initially heard about the story Chris Davenport was working on and thought, wow, this is an amazing multimedia opportunity. I went to Whitney and asked her if she’d like to work on it with me. We huddled with Chris and storyboarded out a basic flow for the intro video and the entire piece — how it would be structured and how we should integrate the graphics with the videos. Read more about how we developed this multimedia piece »

Alternative story formats: Investigation into Alaska native corporations

Two Worlds
Two Worlds

This investigation, which launched September 30, focused on Alaska Native Corporations and their explosive growth during the last decade. I combined photos, graphics and video in a multimedia slideshow. The intention was to build a relationship between the corporations and the shareholders they represent. Alaska natives are some of the nation’s poorest people, and some of the corporations that were supposed to be helping them make their way have instead been funneling money back to contractors in Washington.

Read more and see screen grabs »