Analyzing the U.S. tax code, break by break, and other recent charts

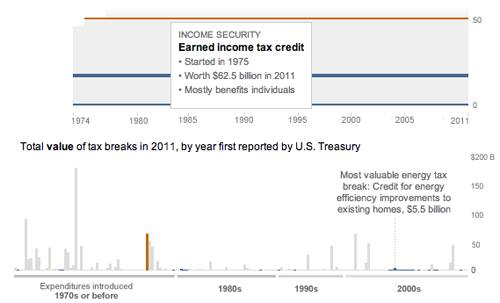
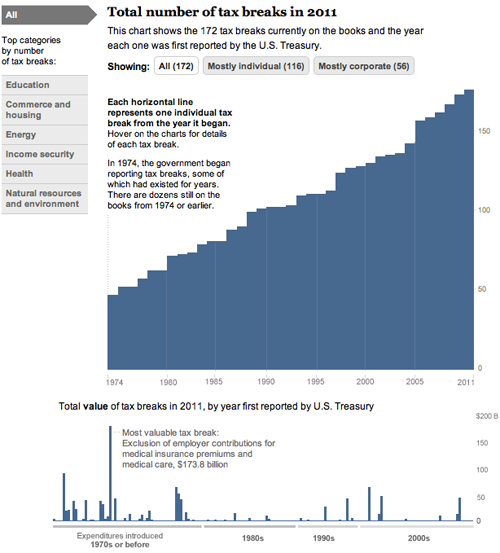
Today, we came out with a new graphic that looks at the tax breaks on the books this year. It is part of Running in the Red, a series the Post has been running for the past few months, and accompanied Lori Montgomery’s front-page story, “Ever-increasing tax breaks for U.S. families eclipse benefits for special interests,” a great story that explains spending through the tax code.

The graphic is all CSS and JavaScript. With charts that only have bars, it’s simple to dynamically add sized divs with background colors that create charts. The data will update automatically if necessary and it works across all browsers and mobile platforms with no workarounds:

And has details for each of the 172 breaks currently active (see below). Added bonus: I learned a ton about the tax code.
And a couple more (relatively) recent charts:

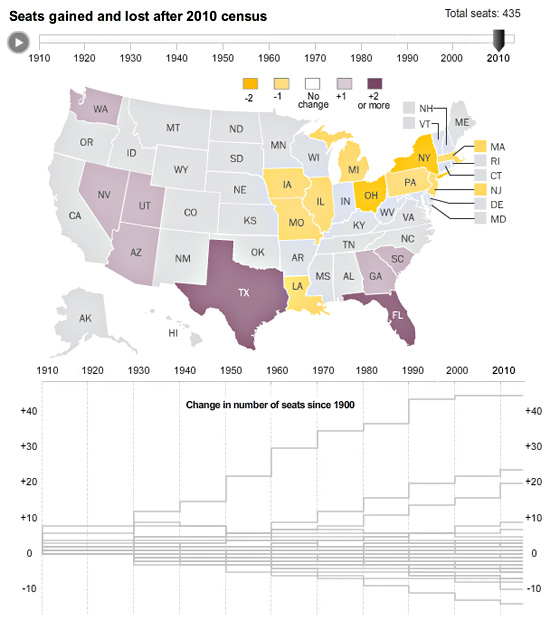
This one I worked on with Alicia Parlapiano and Neil Irwin. Because I wanted to create animate transitions and interactivity, I used Flash to create this graphic. It has detailed drilldowns to look at employment in each sector of the economy. I tried to inject more annotation into this graphic (and the taxes one above) than we have done in the past with data-driven graphics. Instead of throwing a bunch of data out there, we’re providing more context and guided views — by category and by sector versus a completely self-guided data dive.

This was a fun chart I helped our intern, Heather Billings, with at the beginning of the summer. We used flot to make these charts showing how the lead changed between the Heat and the Mavericks during the NBA finals. This was particularly fun for me because I got really into the NBA finals this year and watched every game. I know, hard to believe, but true. I was a having a great time analyzing the outcome of the games and reading all the news — and if you missed it, this was a great article from Bill Simmons at Grantland.

And another one about when and if China’s economy will pass the United States to become the world’s largest.
iPhone photography

My first shot at iPhone photography. I found it really fun — I love the filters and the size of the phone makes it easy to carry around. I was mostly using Hipstamatic and Instagram, and shot a few panoramas with the Photosynth app. To see the full gallery, go here.

Most of these were taken in New Hampshire (Lake Winnepesaukee and Portsmouth), Boston, and Hendersonville, N.C. Here’s a shot of Mt. Major near Alton Bay, N.H. Click the image to enlarge.

Moving away from Flash: A look at JavaScript drawing libraries

Excerpts from a new post for WP’s @innovations blog:
[Go to the blog to read the whole thing]

When Apple announced early last year that it would not support Flash on the iPhone and iPad, a passionate conversation erupted in the world of web development: Was Flash dead? If not, how would it survive? When should it be used? News developers asked these questions as well, and, at least in our newsroom, the conversation inspired some thinking about how to approach interactive development. Over the past year and a half, there has been steady movement toward more interactivity based on JavaScript and fewer Flash-only experiences.

Sorting out the budget proposals

Last week we published a graphic that compared four federal budget proposals through a series of charts. We used the jQuery library Flot to draw simple, interactive line charts that showed how the debt and deficit would change under the different plans. Flot is very easy to use, flexible and customizable, and is one of many free-to-use JavaScript graphing libraries out there (Dracula, Highcharts and RGraph are a few others). We also built a customized chart with CSS and JavaScript at the bottom of the page to show how different categories of spending would be affected.

Read the rest of the article…

Recap from Malofiej 19

Malofiej
Photos: Malofiej 19 at the University of Navarra

In March, I set out for Pamplona, Spain, to join the jury of Malofiej 19. For three days, we judged hundreds of entries in the digital contest, while colleagues on the print side saw over 1,000 entries. Check out the awards here.

Other jury members came from all over the world — Germany, Argentina, Chile, Spain, Italy, and the United States. I met a ton of awesome people who share a passion for infographics and alternative forms of storytelling. Gert Nielson keeps a good log of the goings on at his blog, Visual Journalism. Kaitlin Yarnall of National Geographic wrote a summary piece for the Society of News Design blog here. Javier Errea, who organizes the event, also wrote a post on his blog (in Spanish).

I really liked Stephen Few’s presentation on Infographics and the Brain — reminding us all to think not only of how we want to present the information, but how it will be perceived. It doesn’t matter how good it looks or how clever we think it is if it misses the basic point: helping people understand information.

I gave my presentation on the power of using social media and user-generated content in graphics. I focused on two types of input — that which comes directly from our users (games, polls, submissions) and that which comes from existing social networks (facebook, twitter, foursquare, flickr). The amount of information out there is incredible, and we have to figure out how to use it in ways that show how people fit into their world. The opportunities are endless. Recently some interesting projects have come out that harness some of that power, including the Wall Street Journal’s Foursquare project, a look at check-ins over a week’s time in New York and San Francisco, and the New York Times Bin Laden emotion grid.

For more photos from Malofiej, go here.

Global Warning

A full five months after wrapping the Global Warning project, I think it’s time to do a blog post about it! I spent last fall working with a team of students on a National Security Reporting project at Northwestern University’s Medill School of Journalism. I was an adjunct professor, teaching the students multimedia design and light programming, and serving as the design lead for the project, which was led by Ellen Shearer and Josh Meyer.

After spending a couple of months in the discovery and ideas phases, we decided on several graphics that would address the main topic of the project: How could climate change affect national security?

Read more…

Mapping the news: Libya and Japan

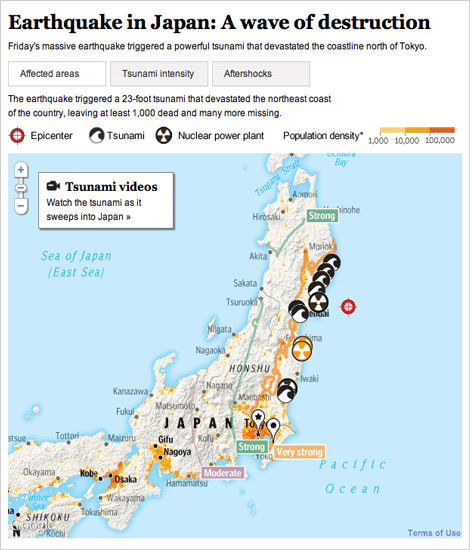
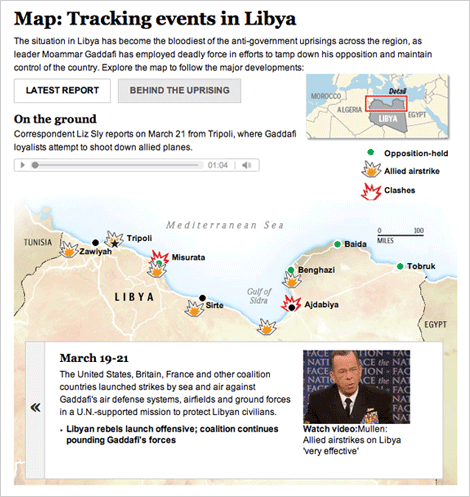
The past several weeks have been full of foreign news, and we have been producing lots of graphics to explain what’s happening. I have worked on these two graphics, one about the earthquake and subsequent tsunami in Japan, and one that explains what is going on in Libya.

For a full explanation of the process of creating the Japan graphic, visit the new Innovations blog at the WP (excerpted below):

Friday morning, as news of the earthquake in Japan spread, we started pulling together an interactive map that would show readers where and how events unfolded. Over the next 36 hours, we would continually expand and improve the information, design and interactivity of the map as the news of the earthquake and tsunami came in. Read more »

For Libya, we combined an event tracker with audio and video from the ground. The reports from correspondents on the ground is my favorite part.

Both graphics are done using javascript and jquery, so check them out on your tablet devices!

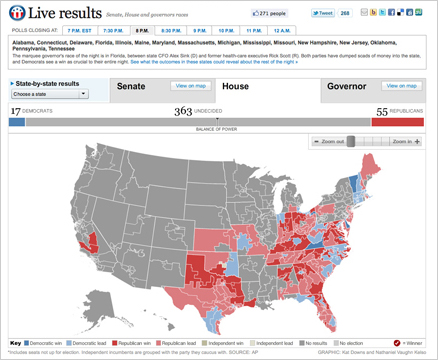
Creating Live Election Results Maps

Live Results: House

On Nov. 2, midterm election day, we put up these maps that tracked the results as they came in. For Senate and Governors we had state and county-level data, and we had House districts as well. This suite of maps was published in The Washington Post, as well as on Yahoo! News and the Telegraph (UK). The maps have balance of power charting and tabular results as well as zooming and deep linking features. Read more about how we built the maps ยป