Published in The Washington Post, Oct. 14, 2012
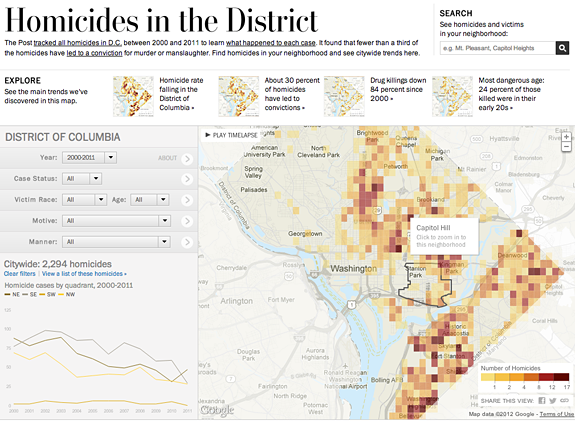
As I designed this app, I was thinking about how to allow people to quickly find homicides in their area. That led to a decision to focus on neighborhoods. We let people see groupings of crimes that are meaningful to them in both the map and corresponding charts. To surface trends at a city-wide level, we added four promo spots above the map that send people directly to important stories in the app. And a timelapse feature lets people view trends, year by year, across the city and in specific neighborhoods. We’re getting great feedback from users; many people are telling us that they found surprising and intriguing information in the app.
Role: Design, light programming
Tools used: JavaScript, Google Maps API, Flot, CSS
Awards: Gold medal in the SND Digital competition, Silver medal at Malofiej for design
More JavaScript maps: 2010 census, Republican primary tracker, Earthquake in Japan
