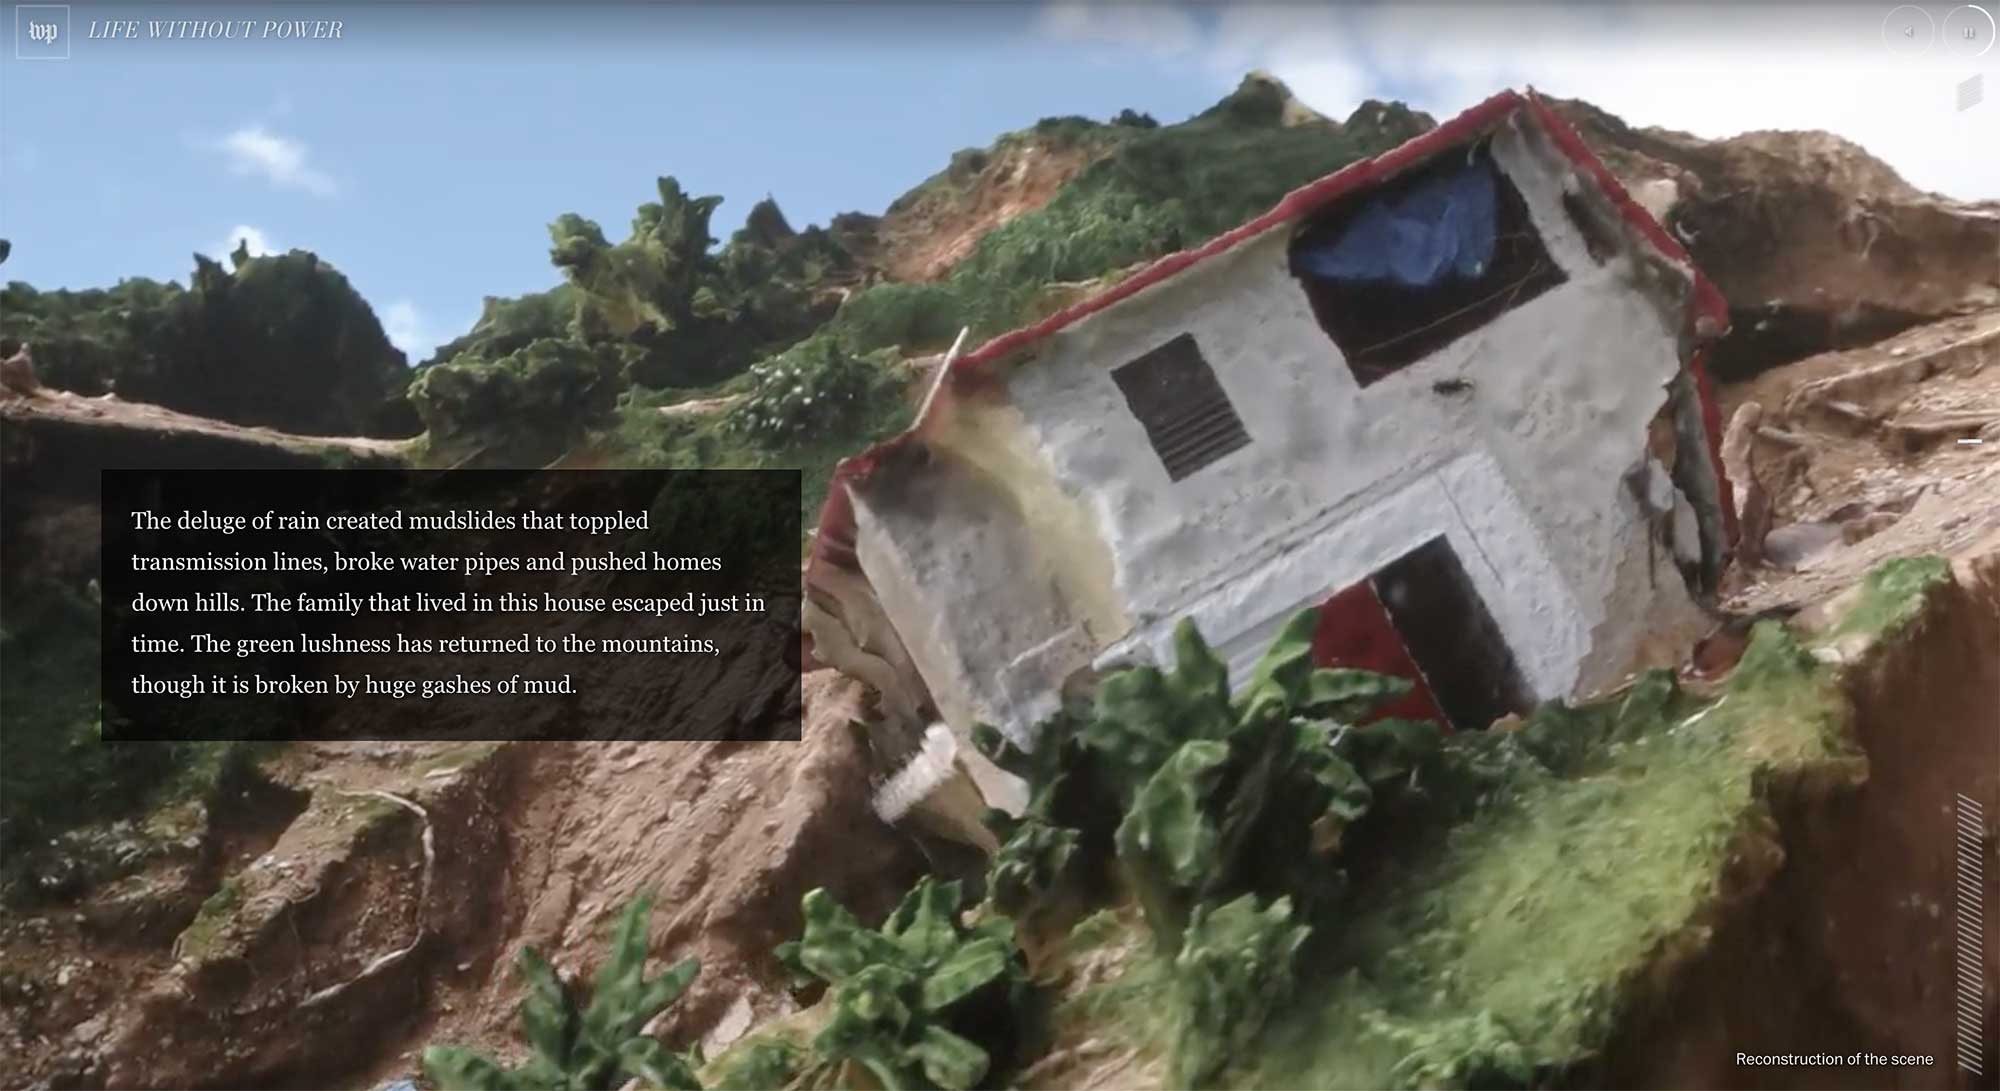
Sin Luz

Published in The Washington Post, December 2017


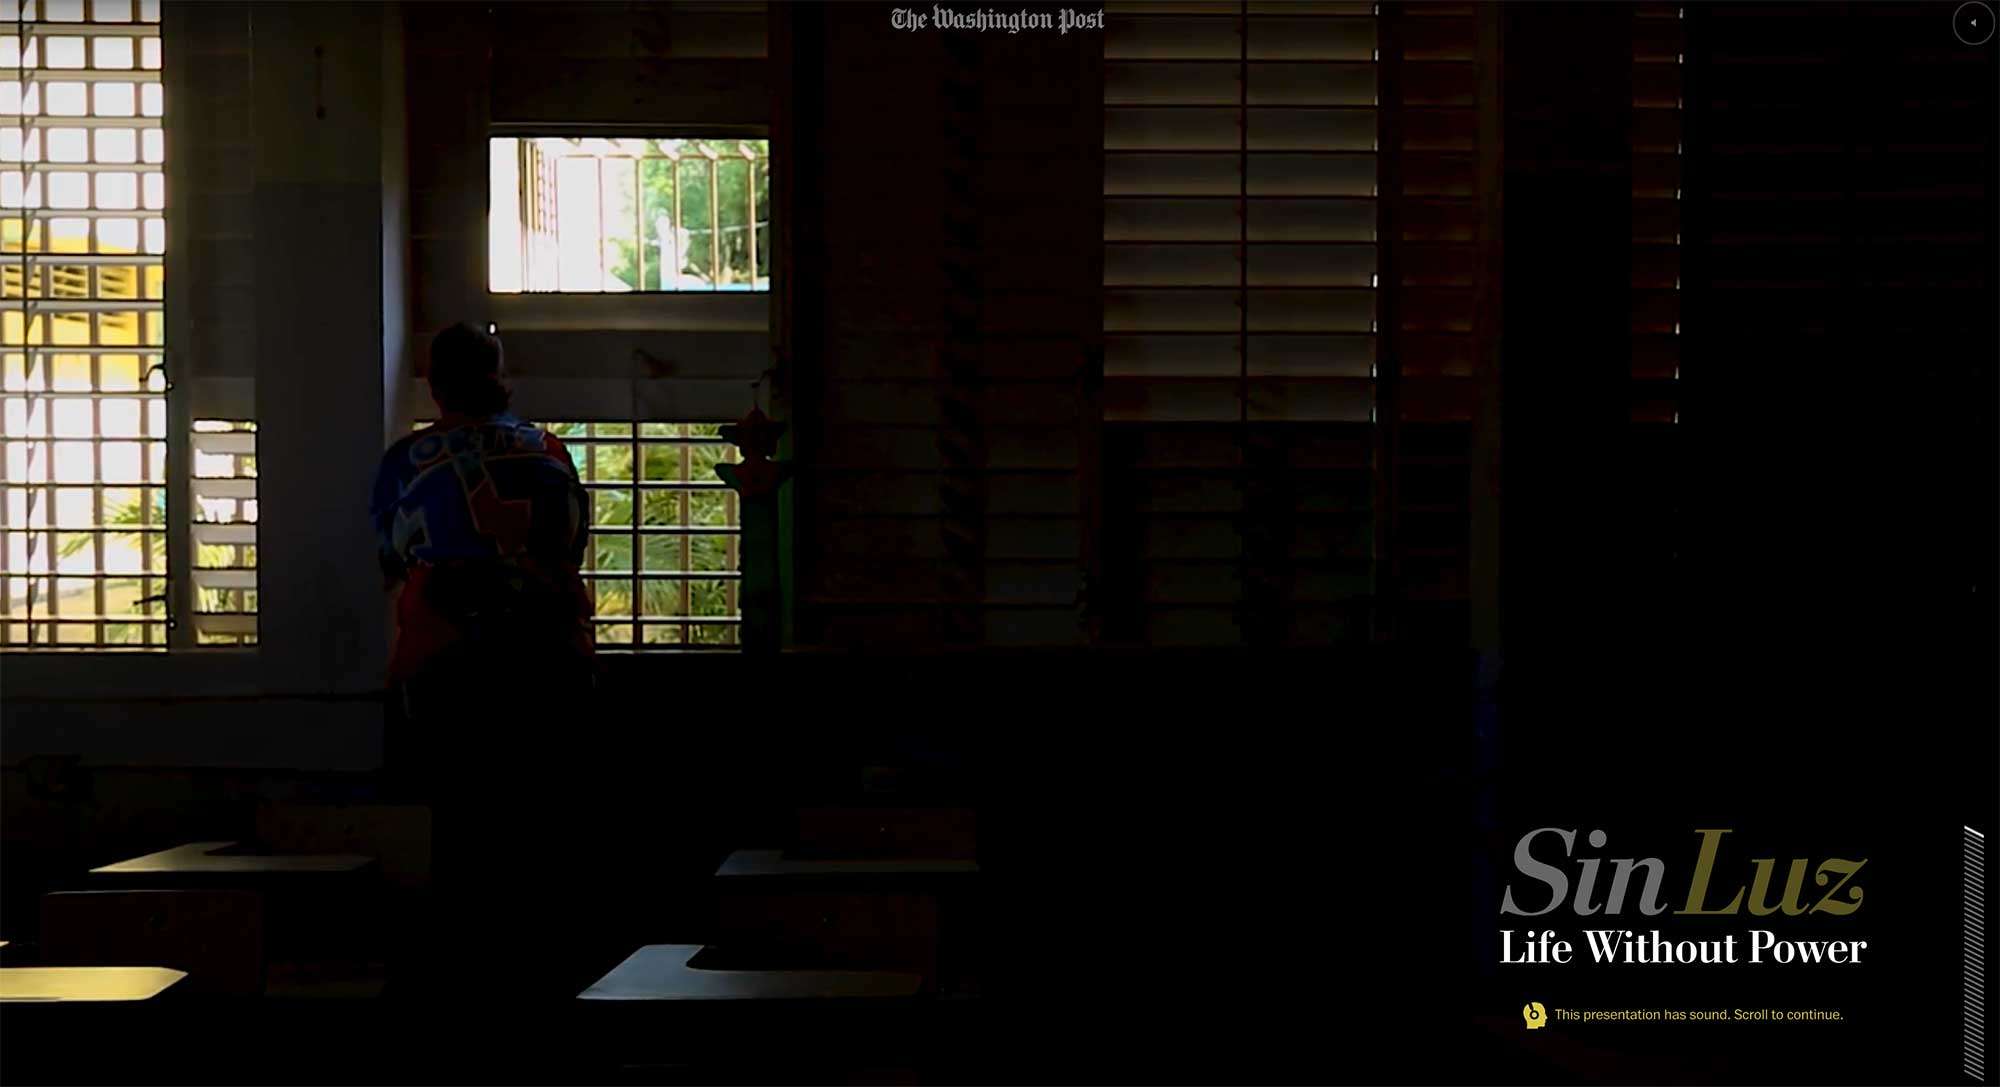
I was a lead editor and project manager on this story, which showed the difficulty of life without power after Hurricane Maria devastated Puerto Rico, and the resilience of the Puerto Rican people as they dealt with the challenges.

Sin Luz

In addition to smart user interface design and an incredibly powerful story, we created 3-D terrain maps of the island and used photogrammetry and drone footage to recreate the scene.

Role: Editing, project management

Awards: World Press Photo, Immersive Storytelling, second prize

A New Age of Walls

Published in The Washington Post, October 2016

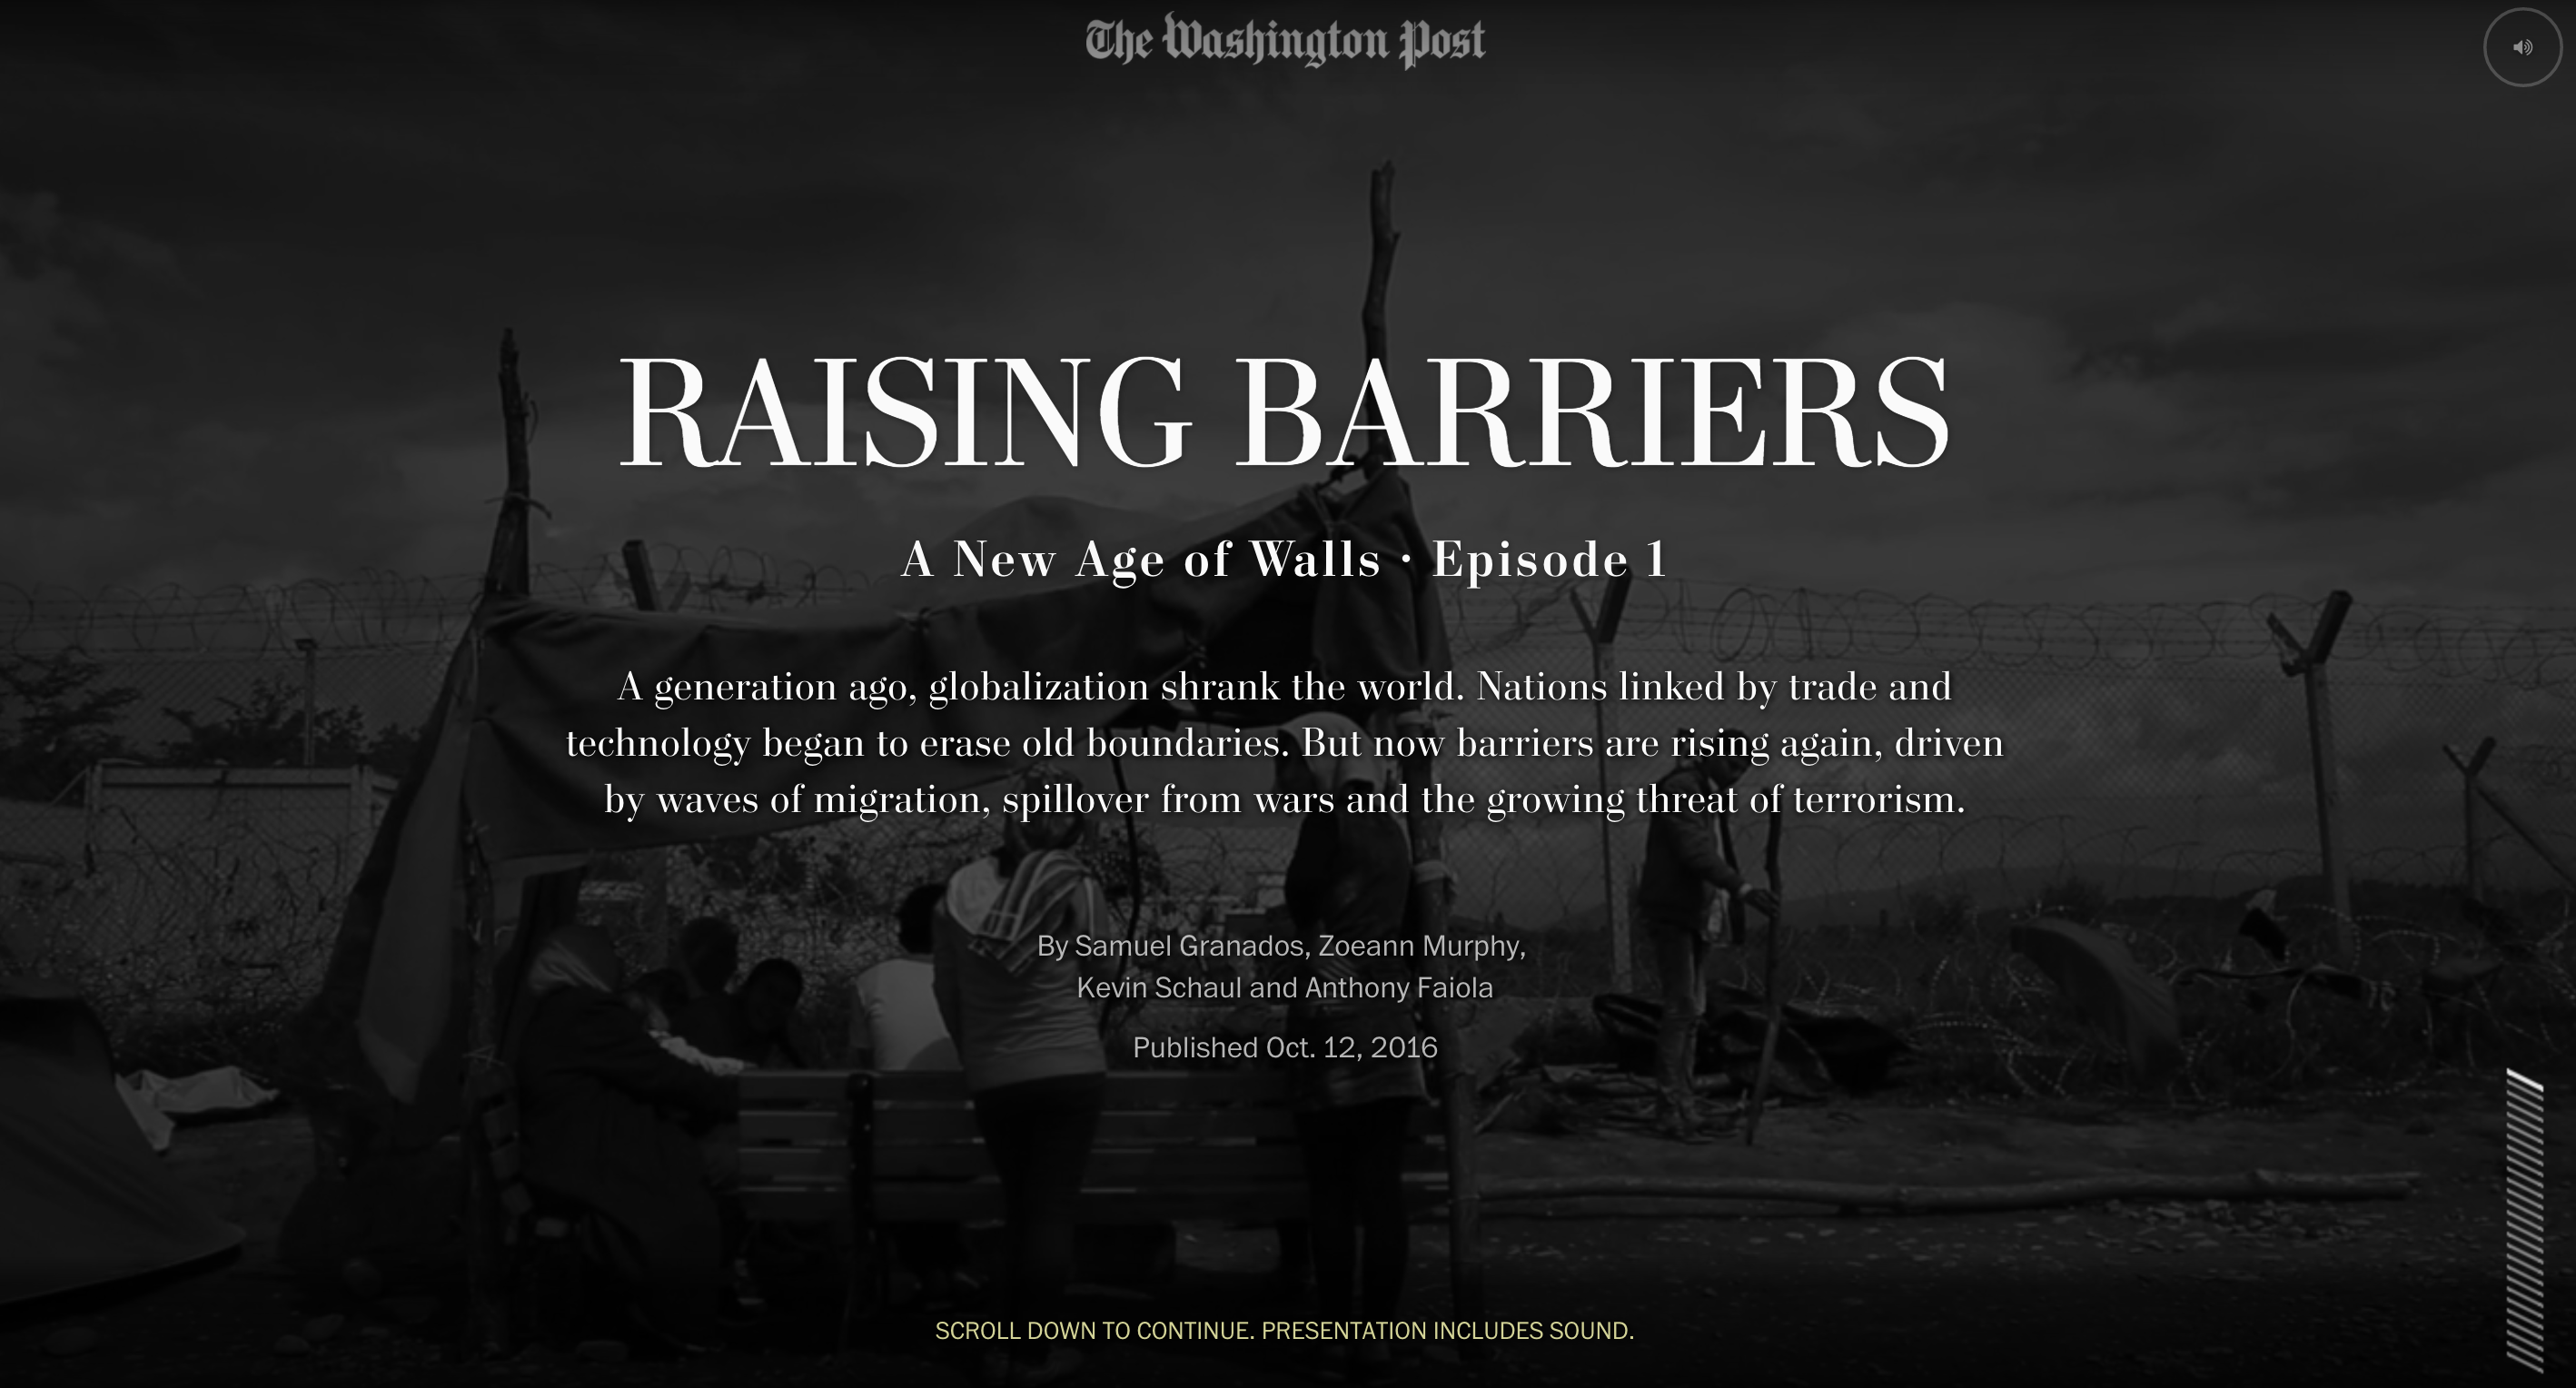
A New Age of Walls

I was the lead editor and project manager on this 3-part series, which explained the rise of barriers worldwide as a means of preventing migration and providing border security. It explored their effectiveness and impact in a deeply compelling narrative that melded text, video and graphics in ways we haven’t tried before. My team led the field reporting in collaboration with foreign correspondents, and I led the editing team, which also included a video editor and the foreign editor.

Role: Editing, project management, storyboarding, prototyping

Awards: Malofiej International Infographics Awards Human Rights Best Graphics Award and Gold medal in features category; Gold medal in the Society of News Design digital awards; Finalist for a Webby award; White House News Photographers Association, First place in Best Multimedia Package; First prize in Innovative Storytelling in World Press Photo’s 2017 Digital Storytelling Contest, Emmy nomination in Outstanding New Approaches: Documentary, and OJA finalist in Excellence and Innovation in Visual Digital Storytelling

In the news:
Washington Post series on border barriers aims to break the mould of digital storytelling (Journalism.co.uk)
If you dream big, you can redefine the way we tell stories in the digital age (The Washington Post on Medium)

Washington Post Olympics graphics and multimedia roundup

Here’s some of what the WaPo team put together for the London Olympics:

The definition of perfection
I designed this piece about how gymnastics scoring worked. Wilson Andrews developed it and edited/animated the videos, and Bonnie Berkowitz did the writing.

definition of perfection

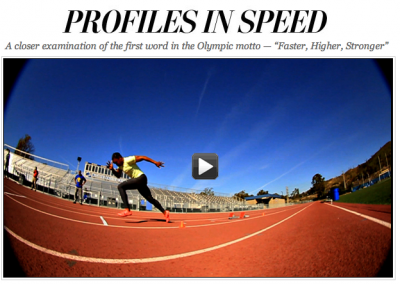
Profiles in Speed
This six-part series we developed in the run-up to the Olympics featured greats like Missy Franklin, Michael Phelps and Carmelita Jeter. Videos, infographics, and awesome articles. I especially love the segment on technology.

profiles in speed

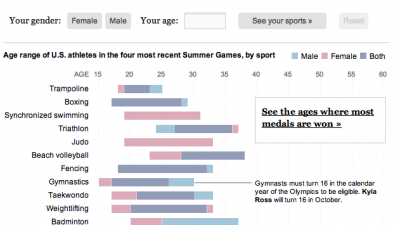
Are you over the hill for Olympic sports?
As part of the Profiles in Speed series, I developed this graphic which lets you see where you fit into the Olympic age spectrum. Flowing Data wrote about it here.

over the hill

Four more pieces after the jump! »

New year, new post

It’s been a busy few months, but I’m gonna squeeze in a post for January! I’ve switched jobs at the Post and moved into a new role, Interactive Projects Editor, focusing on creating interactive projects that combine design and graphics with video, photography and social media. I’m really looking forward to the new challenge. In other news, I’m getting used to the new delicious and trying out this ‘stacks’ thing. I’ve got a few going, namely one on interactive maps and one for games and quizzes. I’ll keep those updated as I collect links around the web. And, some of my recent work….

Pinocchio tracker
The tracker part of this was originally done with Tableau, but we decided to rework it and to add a game element to it. It’s on a page of its own as well as in the right rail on all our politics content. Try it out!

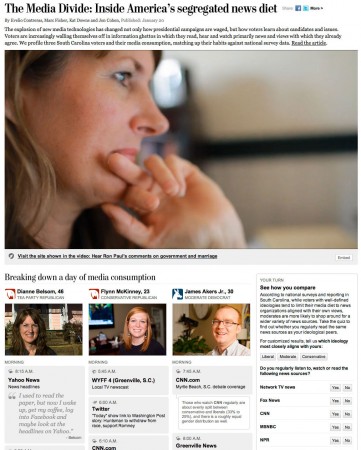
The Media Divide
This piece was born from a project by Marc Fisher to track what media people consume in a day and see how it reflects their ideology. Evelio Contreras did this great video and we put it together in a calendar with links to all the news they watched/read/listened to, and combined that with a poll.
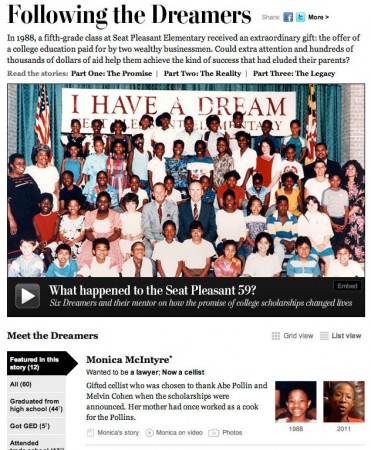
The Seat Pleasant 59
This project leads with Whitney Shefte’s awesome video about a class of students who were promised that if they graduated from high school, their college would be paid for. We tracked down the students and found out where they are now. My contribution was the list/grid view and filtering along with itemizing content for each of the dreamers.
Royal rumors (and some graphics fun)

With Kate and Will back in the news for the rumors about a pregnancy with twins (not true, by the way), I thought, “Hey, what better opportunity to make up for the fact that I never wrote about our royal wedding graphics on the blog?” So here I am. Royal couple junkies, enjoy. And if you’re a true royal wedding fanatic, you might enjoy this video about my roommate, coincidentally also named Kate Middleton (this one is true).

The main piece I worked on was the Westminster Abbey and parade route tour. Sohail Al-Jamea and Alberto Cuadra worked together on the 3-D renderings and animations, and I layered on the interactivity and created the Google Earth flyovers and, with help from Laris Karklis, the parade route maps and Street View layers.

Continue to see how we made the interactive parade route, and how we created 3 types of javascript quizzes »

Mapping the news: Libya and Japan

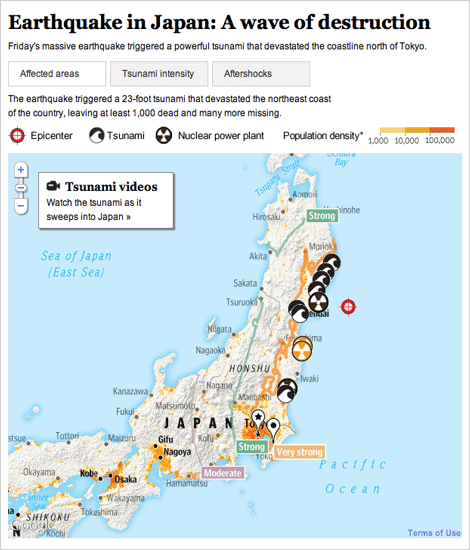
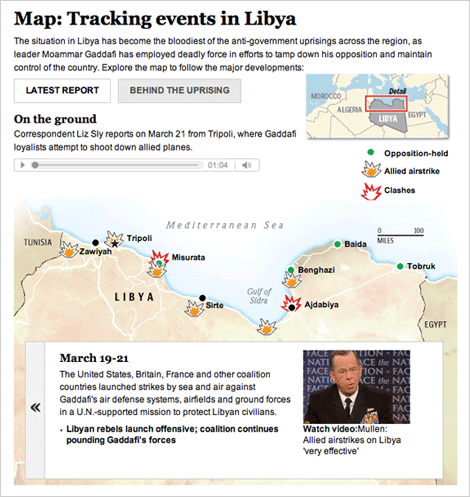
The past several weeks have been full of foreign news, and we have been producing lots of graphics to explain what’s happening. I have worked on these two graphics, one about the earthquake and subsequent tsunami in Japan, and one that explains what is going on in Libya.

For a full explanation of the process of creating the Japan graphic, visit the new Innovations blog at the WP (excerpted below):

Friday morning, as news of the earthquake in Japan spread, we started pulling together an interactive map that would show readers where and how events unfolded. Over the next 36 hours, we would continually expand and improve the information, design and interactivity of the map as the news of the earthquake and tsunami came in. Read more »

For Libya, we combined an event tracker with audio and video from the ground. The reports from correspondents on the ground is my favorite part.

Both graphics are done using javascript and jquery, so check them out on your tablet devices!

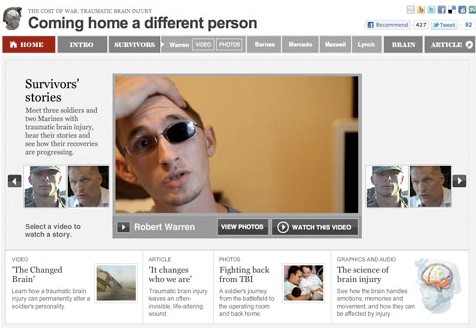
The Cost of War

TBI Menu

This past Sunday “Coming home a different person” launched, a project I worked on with Whitney Shefte and Alberto Cuadra, alongside reporter Chris Davenport. It features an overview video that covers the increases in traumatic brain injury cases and what doctors are doing to treat it, as well as five case studies of three soldiers and two Marines, and a graphic that explains the science of brain injury.

I initially heard about the story Chris Davenport was working on and thought, wow, this is an amazing multimedia opportunity. I went to Whitney and asked her if she’d like to work on it with me. We huddled with Chris and storyboarded out a basic flow for the intro video and the entire piece — how it would be structured and how we should integrate the graphics with the videos. Read more about how we developed this multimedia piece »