Royal rumors (and some graphics fun)

With Kate and Will back in the news for the rumors about a pregnancy with twins (not true, by the way), I thought, “Hey, what better opportunity to make up for the fact that I never wrote about our royal wedding graphics on the blog?” So here I am. Royal couple junkies, enjoy. And if you’re a true royal wedding fanatic, you might enjoy this video about my roommate, coincidentally also named Kate Middleton (this one is true).

The main piece I worked on was the Westminster Abbey and parade route tour. Sohail Al-Jamea and Alberto Cuadra worked together on the 3-D renderings and animations, and I layered on the interactivity and created the Google Earth flyovers and, with help from Laris Karklis, the parade route maps and Street View layers.

Continue to see how we made the interactive parade route, and how we created 3 types of javascript quizzes »

Analyzing the U.S. tax code, break by break, and other recent charts

Today, we came out with a new graphic that looks at the tax breaks on the books this year. It is part of Running in the Red, a series the Post has been running for the past few months, and accompanied Lori Montgomery’s front-page story, “Ever-increasing tax breaks for U.S. families eclipse benefits for special interests,” a great story that explains spending through the tax code.

The graphic is all CSS and JavaScript. With charts that only have bars, it’s simple to dynamically add sized divs with background colors that create charts. The data will update automatically if necessary and it works across all browsers and mobile platforms with no workarounds:
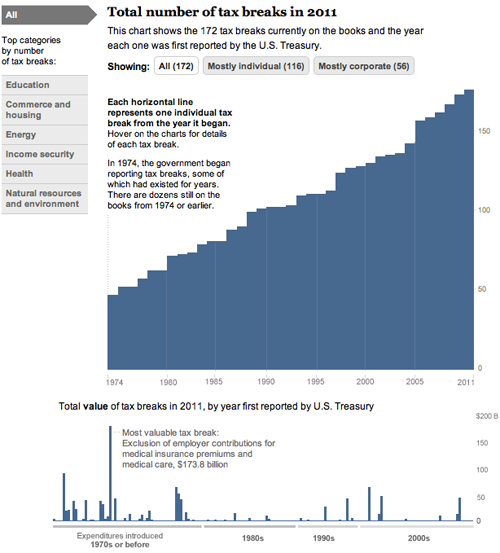
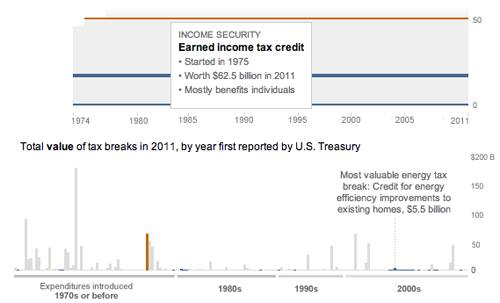
And has details for each of the 172 breaks currently active (see below). Added bonus: I learned a ton about the tax code.
And a couple more (relatively) recent charts:

This one I worked on with Alicia Parlapiano and Neil Irwin. Because I wanted to create animate transitions and interactivity, I used Flash to create this graphic. It has detailed drilldowns to look at employment in each sector of the economy. I tried to inject more annotation into this graphic (and the taxes one above) than we have done in the past with data-driven graphics. Instead of throwing a bunch of data out there, we’re providing more context and guided views — by category and by sector versus a completely self-guided data dive.

This was a fun chart I helped our intern, Heather Billings, with at the beginning of the summer. We used flot to make these charts showing how the lead changed between the Heat and the Mavericks during the NBA finals. This was particularly fun for me because I got really into the NBA finals this year and watched every game. I know, hard to believe, but true. I was a having a great time analyzing the outcome of the games and reading all the news — and if you missed it, this was a great article from Bill Simmons at Grantland.

And another one about when and if China’s economy will pass the United States to become the world’s largest.

A look at the life of an alleged spy

The spy next door?
The spy next door?

Last week, after the news broke that one of the 10 alleged Russian spies arrested by the FBI most recently lived and worked in Arlington, Va., Ben de la Cruz came up with the idea to do some panos of the scenes where the alleged spy lived his life. We talked through how we’d like to present it and how the story would flow through the audio and panos. Then Ben worked with Alex Garcia to shoot and stitch the panos and he wrote and recorded the narration. I put together the piece in a slideshow format, with audio and a pano for each location on the map. It took about 6 hours of my time to put together. It’s a nice little piece that’s a window into the life of a spy — something we’re all very curious about.

2010 Political Race Maps: House, Senate and Governors

2010 Campaign: Congressional Races

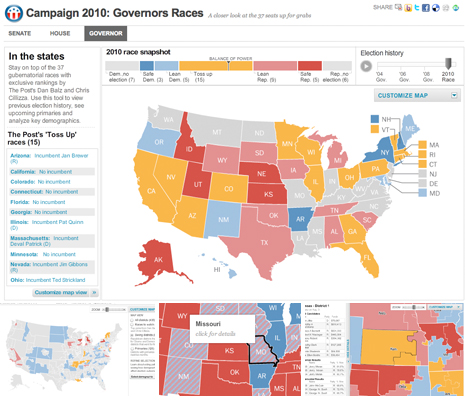
These three new race maps (house, senate, and governors) launched today with the new PostPolitics section of The Washington Post. I worked with Karen Yourish and Dan Keating, who are absolutely amazing data whizzes, to get the data together for the project, and Nathaniel Vaughn Kelso gave me some great base maps to start with. We really wanted to give a complete picture of the 2010 races, so we have current race ratings (for house, we have state of the race), election history for each district or state, and demographic information that lets you see some cool patterns — like how states vote when they have a high percentage of seniors or high poverty rates. Keep reading this post »

The Politics of the Prize

I created this graphic about controversial winners in Nobel Peace Prize history based off of some of the development work I’d done for the helicopters project. The timeline and slideshow componenets are very similar, I just switched the look of the slideshow portion and made the timeline interact with the slideshow.

[Politics of the Prize]
Timeline: Politics of the Prize

Reusing the classes I’d created saved a lot of time — it only took a few hours to create this piece. With the improvements we could have a 15-minute turnaround on future projects.