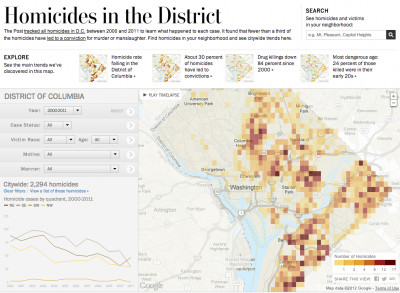
We just launched this interactive map with details about 2,294 homicides that occurred in D.C. between 2000 and 2011. You can find the killings in your neighborhood, follow the trends over time, and learn how the victims died and what happened to their cases.
Key findings featured in the graphic:
Click the headline to jump straight to that view in the map.
Homicides in D.C. are down 55 percent since 2000
The number of homicides in the District fell last year to 108, a 49-year low. Despite the decline, homicide continues to be a tough crime to solve and prosecute in the city.
Motives: Drug killings down 84 percent
The most common motives for homicide in D.C. are arguments, drugs and retaliation. About 2 percent are classified as gang-related. Homicides involving drugs have decreased about 84 percent since 2000. Drug-related homicides accounted for eight of the city’s killings last year, compared with 49 in 2000.
Most dangerous age: 24 percent of those killed were in their early 20s
More than half of the District’s homicide victims between 2000 and 2011 were between the ages of 15 and 29. About 93 percent of those victims were male, and 94 percent were African American.
