I was just poking around my old blog posts and realized that this blog is about to turn five years old on June 7. In honor of that milestone, I plan to completely redesign the blog and add some features. I’m also going to be posting some of my more recent work in the next few days/weeks.
I realize my last post was more than a year and a half ago, and a lot has happened in the interim. About a year ago, I started working at washingtonpost.com. I’ve been working on some really interesting projects, focusing primarily on creating interactive graphics, special report pages, and multimedia presentations.
Here are a some examples of multimedia projects I’ve worked on since starting at the Post:
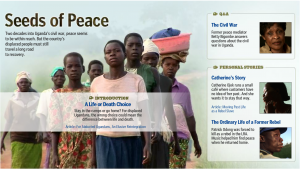
Seeds of Peace: I did this project last July, but I was really happy with the way it turned out. Ben de la Cruz did a wonderful job on these three video stories and a Q&A video, so I had amazing art to work with for the splash page of this piece. A really incredible story of what’s going on in Uganda as civil war continues and people are displaced.
Egypt Panoramas: Post multimedia journalist Alexandra Garcia shot these beautiful panoramas of Egypt on a recent trip. I created this interface, with the pano moving behind the map of Egypt, which also acts as a menu. This project was built totally through XML, so it was really easy to reuse, as we did for the Venice Biennale.

Failing the Chesapeake: This small interactive piece acts as an anchor on the index page of the series. It features a then and now photo piece, a timeline, and several charts showing declining health of the Chesapeake. I also created an interactive panorama from a panorama Whitney Shefte shot of a skipjack, a type of boat used in the Chesapeake.

In the Moment: I did this splash design and set up the video players for this awesome piece the Washingon Post video team did on Barack Obama’s inauguration in January.
![[In the Moment]](http://3.bp.blogspot.com/_1NI9wgirUFw/Spp6yKwuoFI/AAAAAAAAAE0/1fE5fVHmbWw/s400/in-the-moment.jpg)
Israel Strikes Gaza Strip: During conflict in the Gaza Strip last December, I worked with Sarah Sampsel to create this XML-driven map of Israel that shows attack sites and gives a synopsis of the events as they occurred. We updated this throughout the conflict.

Blood on the Mountain: Also, last summer I worked on this timeline about a murder on the Appalachian Trail. I thought it turned out to be interesting and I like the way the map is incorporated into the timeline. Plus, it’s a fascinating story, which never hurts 🙂

And, to top it all off, my very first project at I worked on at the Post: Explore Nationals Park. This project incorporated video, panoramic images and a stadium rendering that we got from the firm that worked on the stadium, HOK Sport. I designed it and put together the dynamic version of some of the graphics, and Nelson Hsu put it all together. It was a great experience to work on something like this when I first arrived and Nelson was a great person to learn from.

I also plan to (finally) post some pictures from India and some stories about the trip.