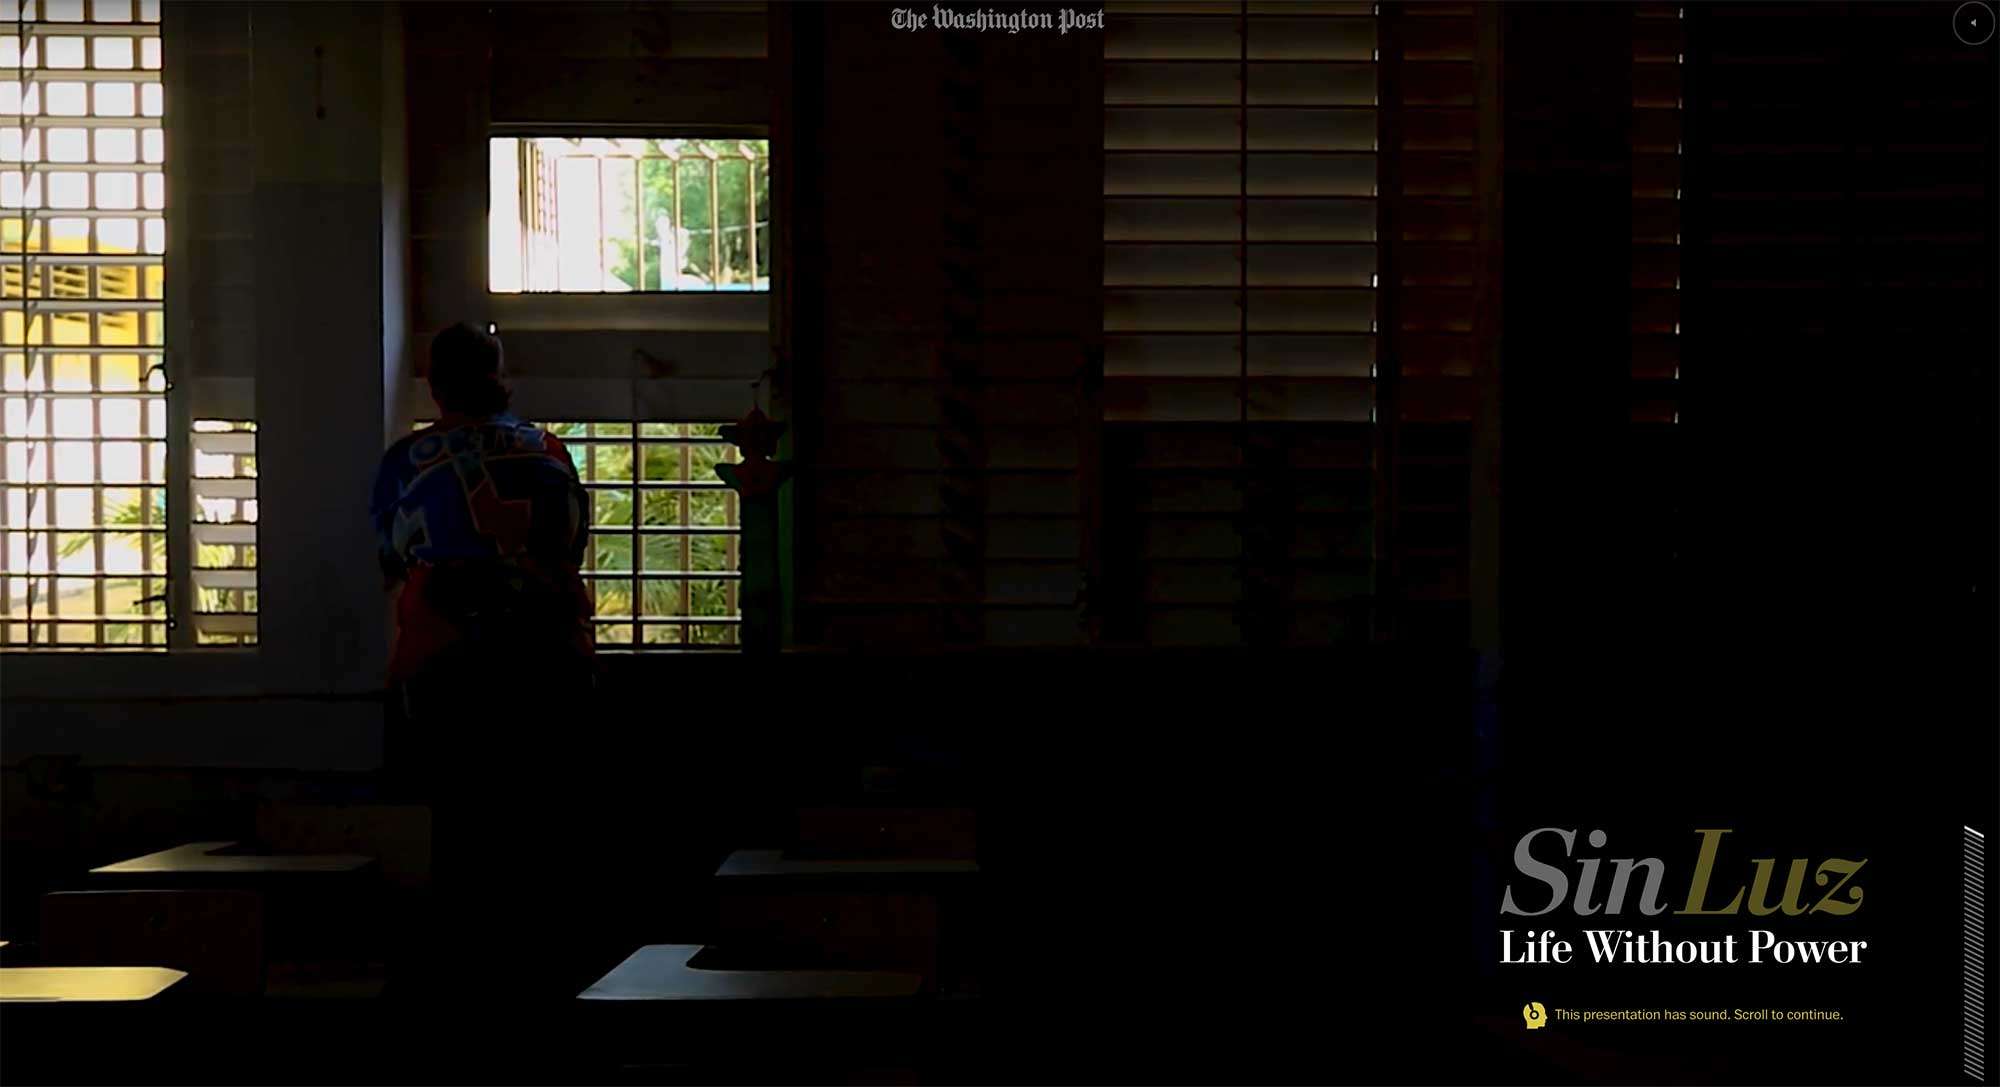
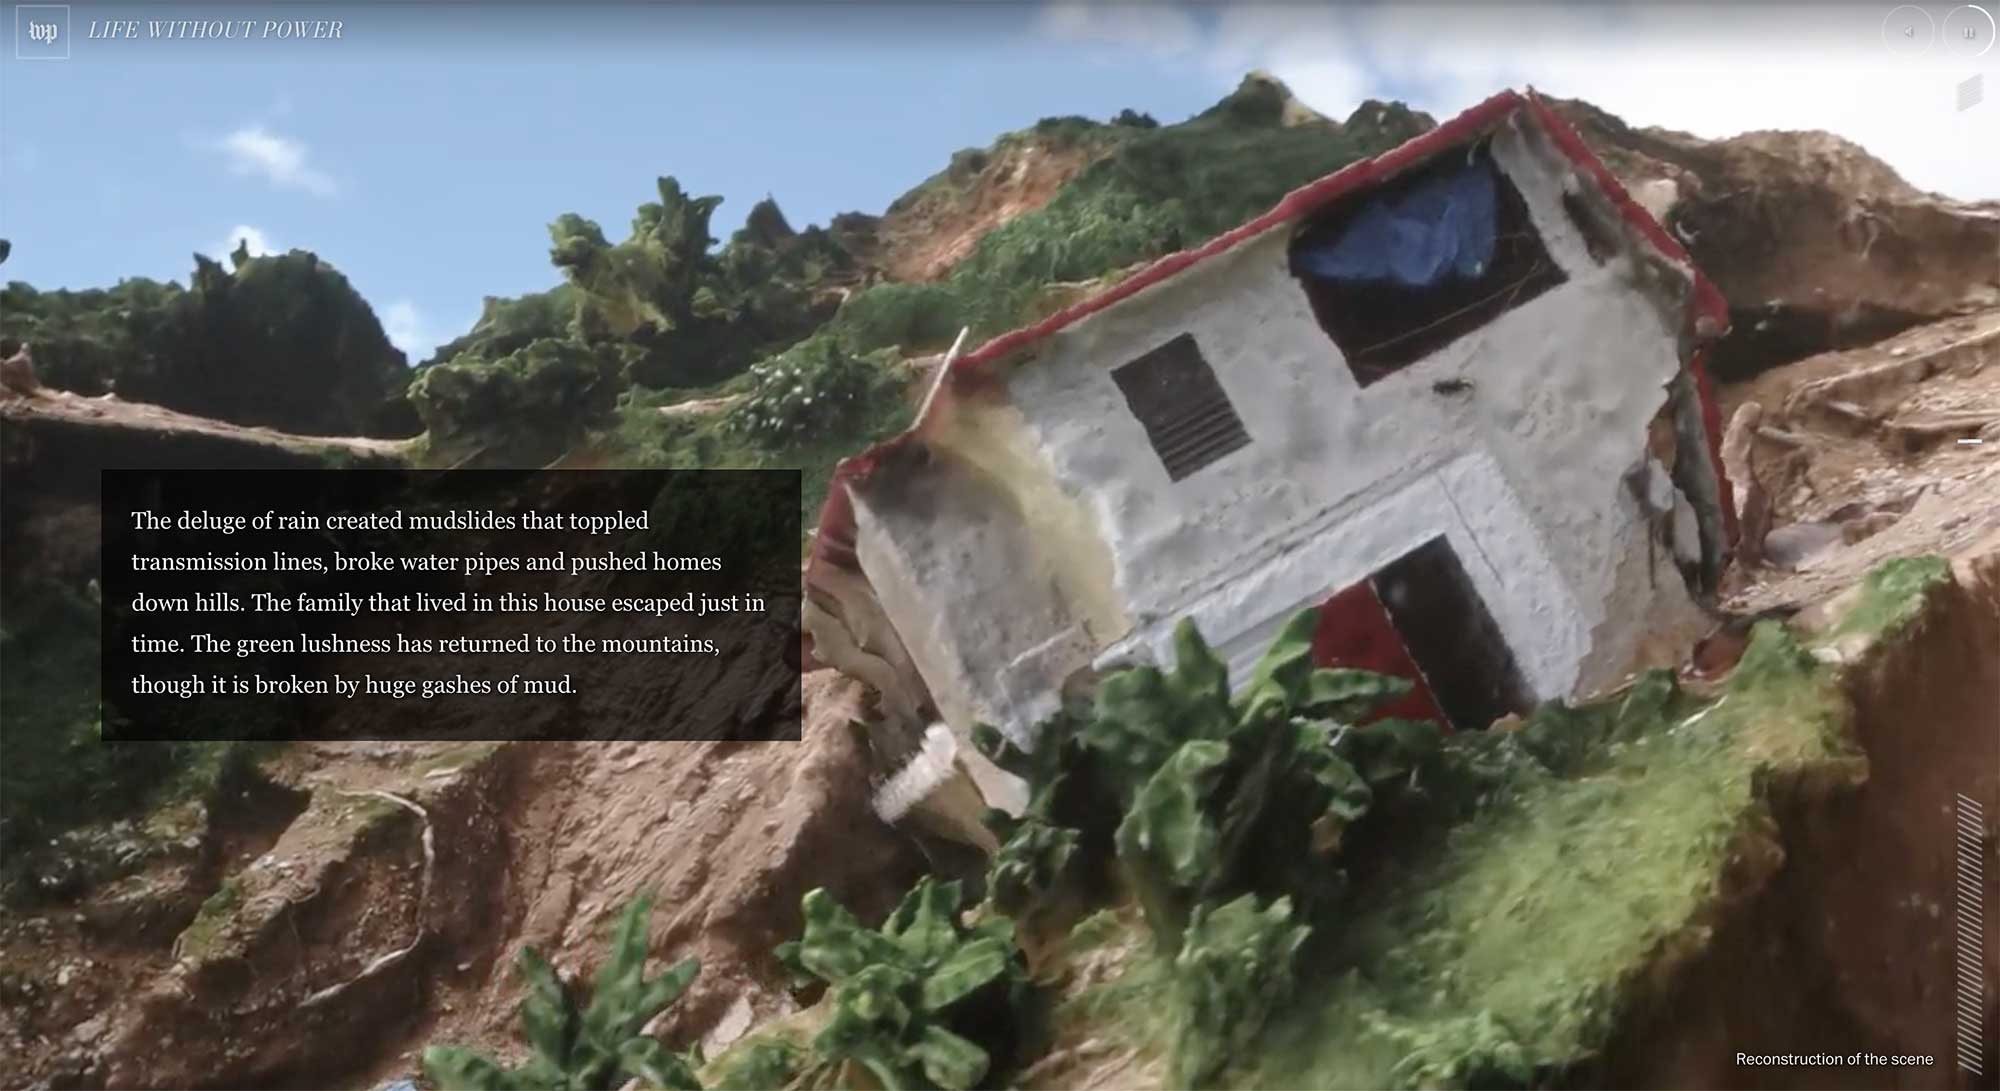
I was a lead editor and project manager on this story, which showed the difficulty of life without power after Hurricane Maria devastated Puerto Rico, and the resilience of the Puerto Rican people as they dealt with the challenges.
In addition to smart user interface design and an incredibly powerful story, we created 3-D terrain maps of the island and used photogrammetry and drone footage to recreate the scene.
Role: Editing, project management
Awards: World Press Photo, Immersive Storytelling, second prize
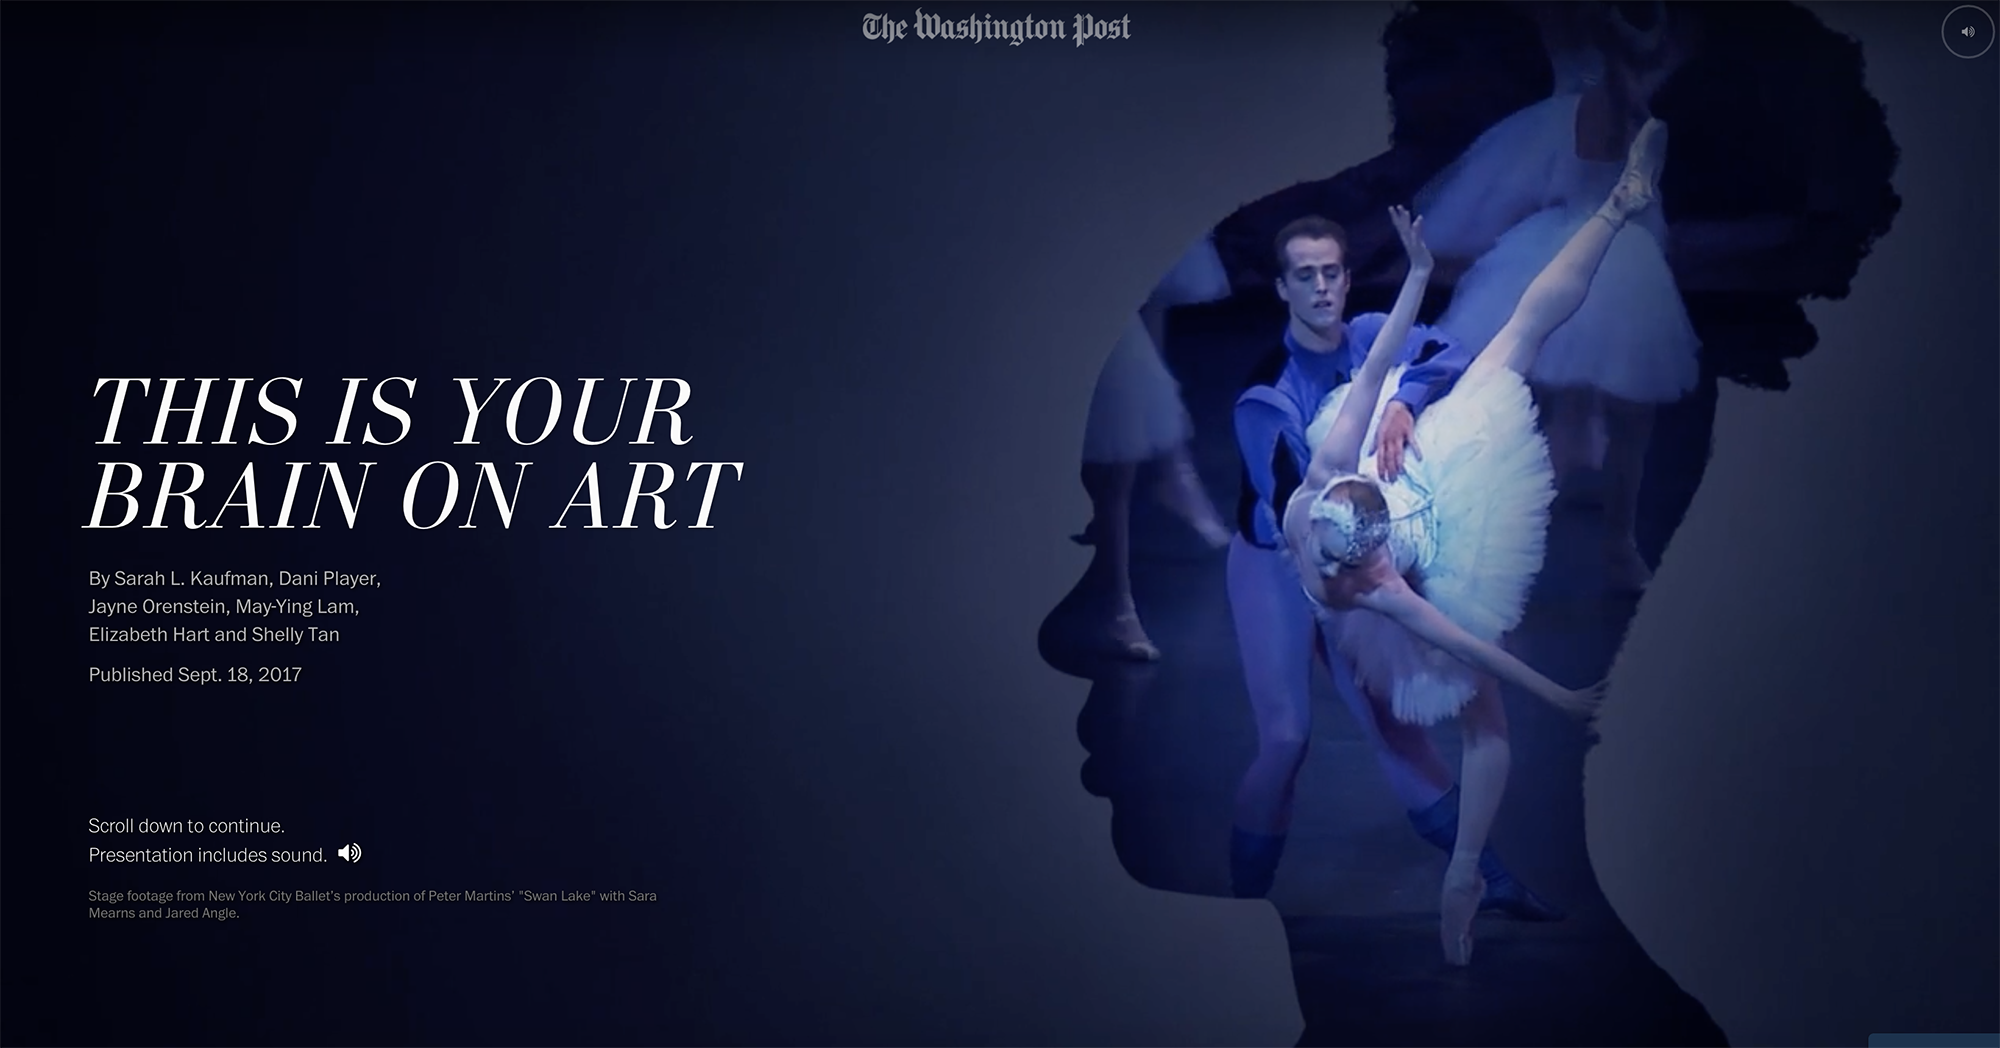
I was a lead editor and project manager on this story, which explained the effect that performance art has on the human brain. We combined video, motion graphics, composite photography and words into a stunningly rich visual experience.
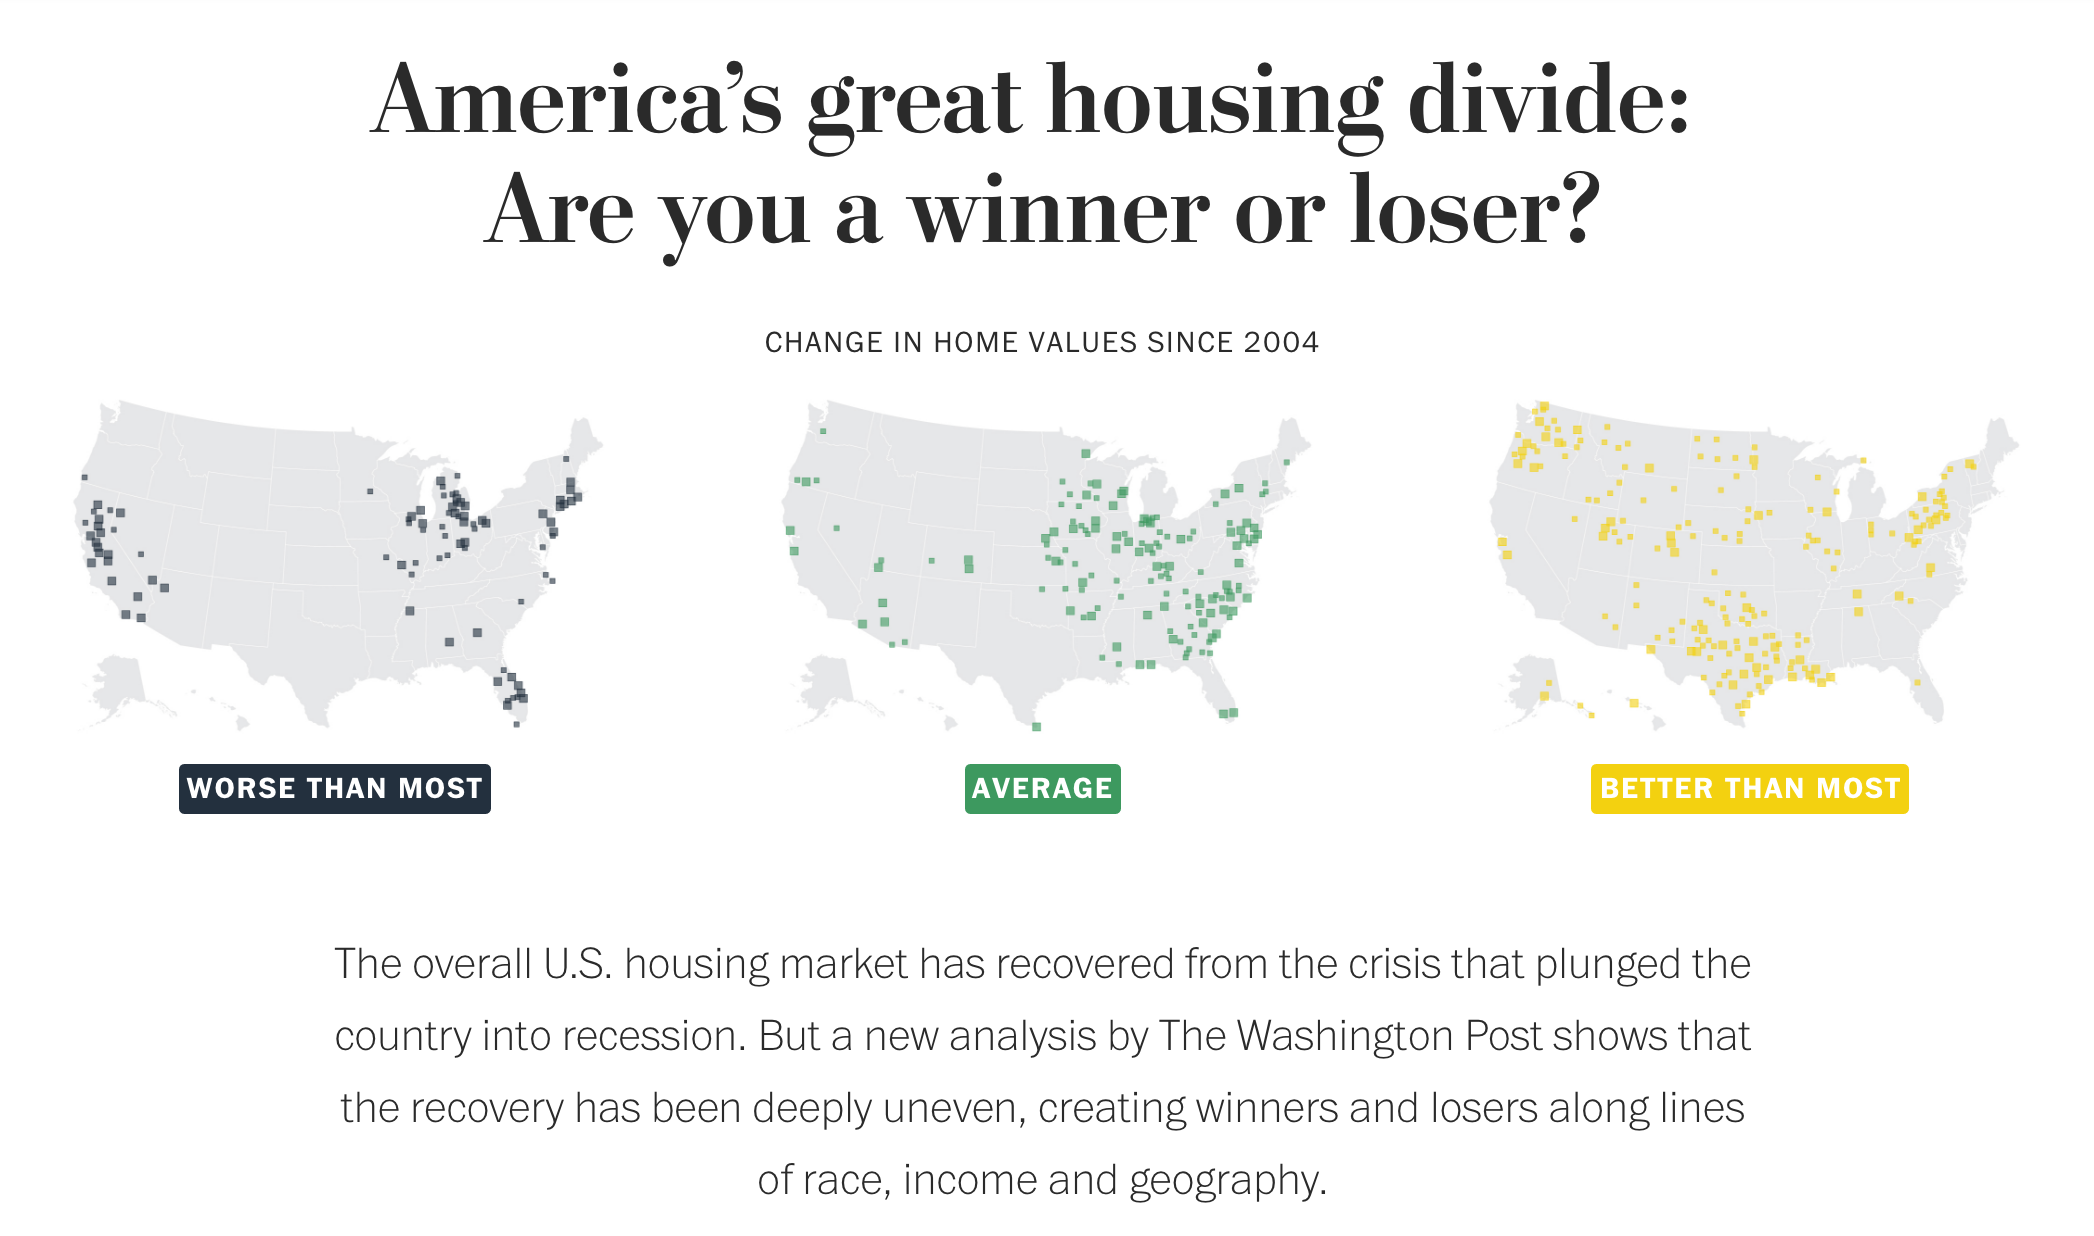
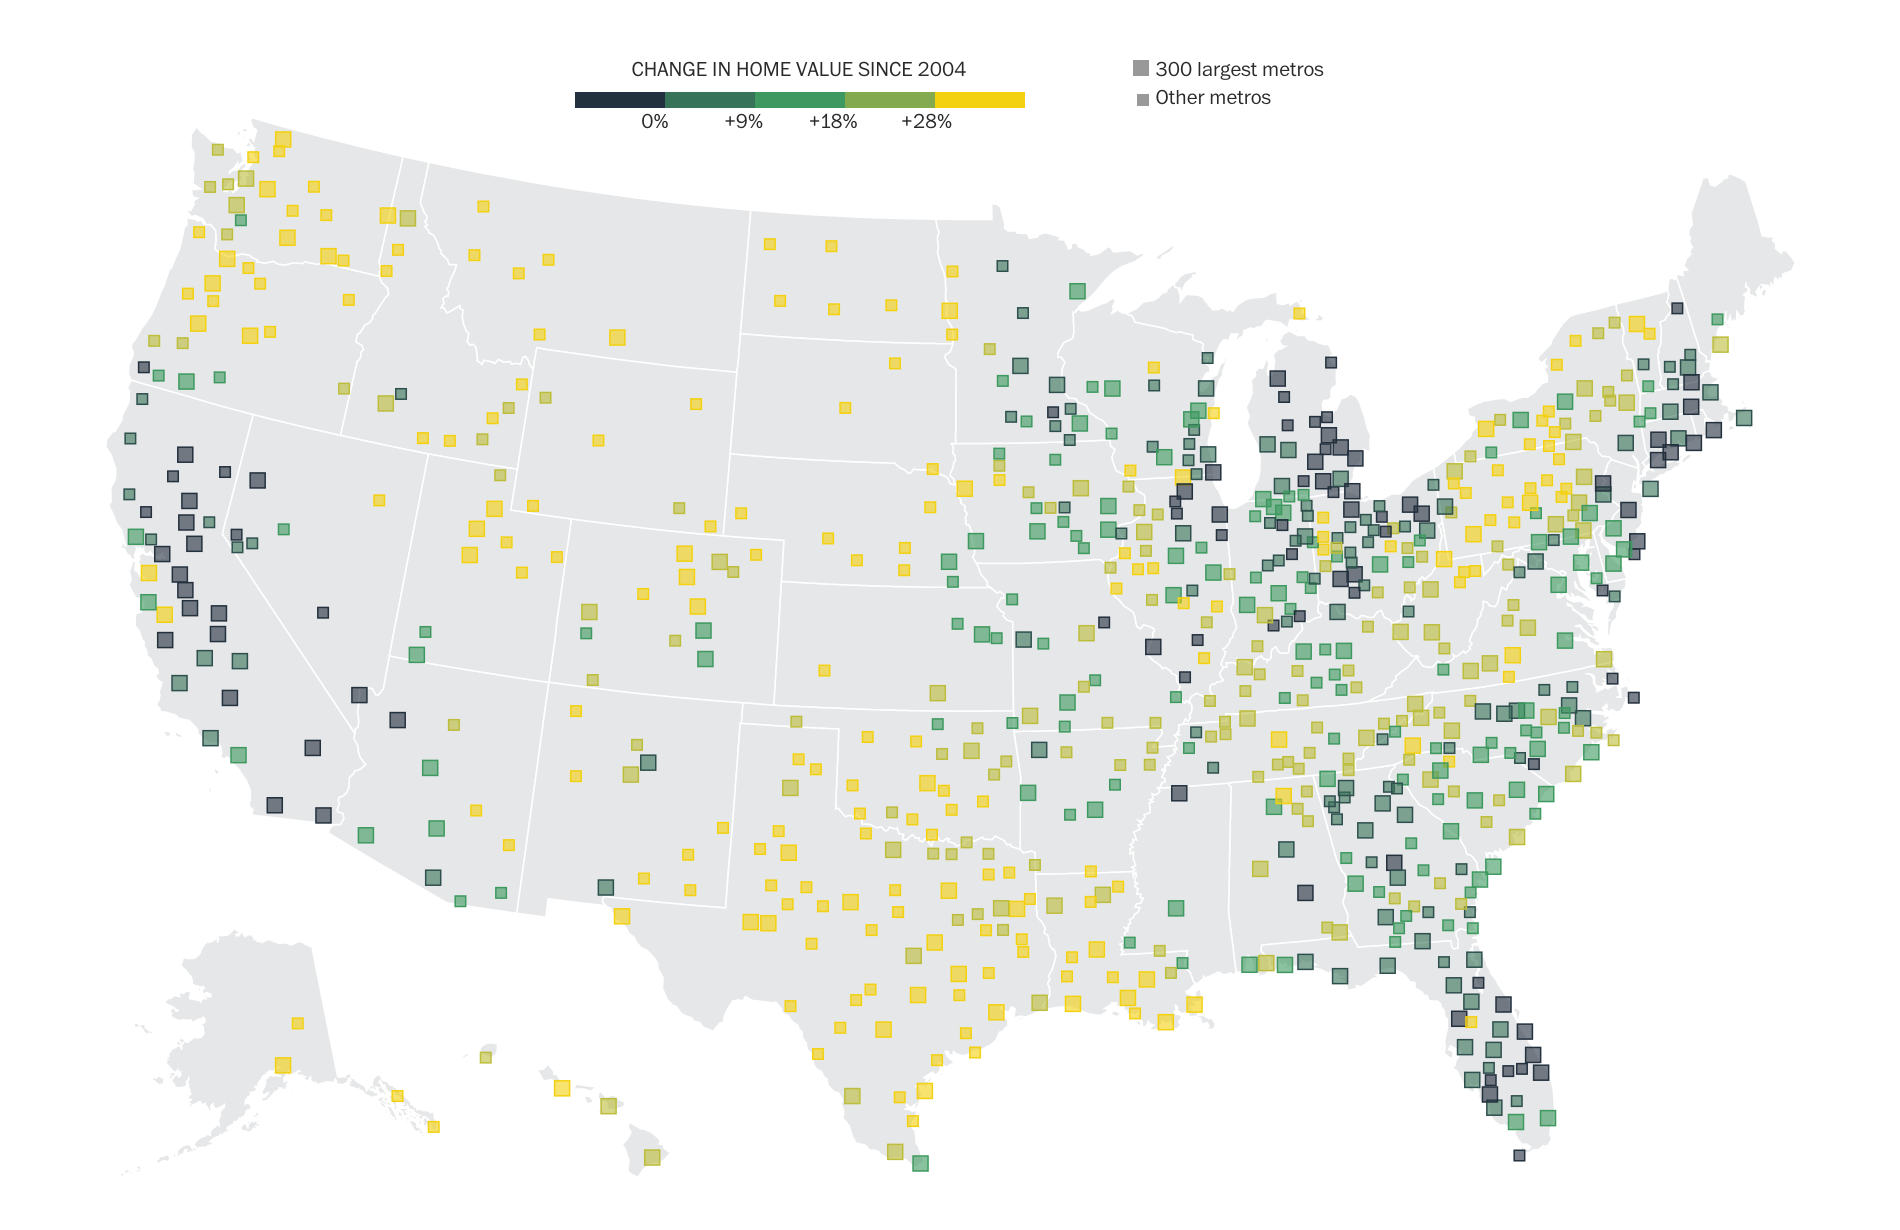
This series about the recovery of the U.S. housing market was instigated by Ted Mellnik, one of our best data reporters. Emily Badger from the Wonkblog came on board and Darla Cameron explored many kinds of visual approaches. Denise Lu took over for Darla when she went on maternity leave and Madia Brown worked on design of the stories that followed the overview.
For digital audiences, we created a geo-focused story with text customized to your zip code, featuring an interactive map of home value changes over the past decade. For print, we combined the Stockton, Calif., story together with the overview of findings that we had online.
Working with our newsletters editor, we created a very successful email campaign that sent emails to readers from the different cities we covered in the series. I love the clean design, simple and intuitive user interface, clear writing and navigation.
Role: Editing, project management, some design and development.
In preparation for the September 14 primaries, I designed this widget for the Politics front. It features house, senate and governors races that auto advance, as well as races to watch, and allows you to see all the races in one convenient spot. It was actually built out by a contractor, Zvi Band of SkeevisArts. We used it on the politics front as the live results came in, and will be able to re-purpose it for future elections.
Reusing the classes I’d created saved a lot of time — it only took a few hours to create this piece. With the improvements we could have a 15-minute turnaround on future projects.
I was just poking around my old blog posts and realized that this blog is about to turn five years old on June 7. In honor of that milestone, I plan to completely redesign the blog and add some features. I’m also going to be posting some of my more recent work in the next few days/weeks.
I realize my last post was more than a year and a half ago, and a lot has happened in the interim. About a year ago, I started working at washingtonpost.com. I’ve been working on some really interesting projects, focusing primarily on creating interactive graphics, special report pages, and multimedia presentations.
Here are a some examples of multimedia projects I’ve worked on since starting at the Post:
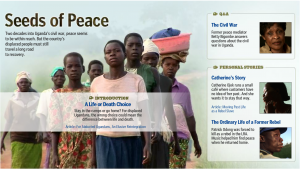
Seeds of Peace: I did this project last July, but I was really happy with the way it turned out. Ben de la Cruz did a wonderful job on these three video stories and a Q&A video, so I had amazing art to work with for the splash page of this piece. A really incredible story of what’s going on in Uganda as civil war continues and people are displaced.
Egypt Panoramas: Post multimedia journalist Alexandra Garcia shot these beautiful panoramas of Egypt on a recent trip. I created this interface, with the pano moving behind the map of Egypt, which also acts as a menu. This project was built totally through XML, so it was really easy to reuse, as we did for the Venice Biennale.
Failing the Chesapeake: This small interactive piece acts as an anchor on the index page of the series. It features a then and now photo piece, a timeline, and several charts showing declining health of the Chesapeake. I also created an interactive panorama from a panorama Whitney Shefte shot of a skipjack, a type of boat used in the Chesapeake.
In the Moment: I did this splash design and set up the video players for this awesome piece the Washingon Post video team did on Barack Obama’s inauguration in January.
Israel Strikes Gaza Strip: During conflict in the Gaza Strip last December, I worked with Sarah Sampsel to create this XML-driven map of Israel that shows attack sites and gives a synopsis of the events as they occurred. We updated this throughout the conflict.
washingtonpost.com
Blood on the Mountain: Also, last summer I worked on this timeline about a murder on the Appalachian Trail. I thought it turned out to be interesting and I like the way the map is incorporated into the timeline. Plus, it’s a fascinating story, which never hurts 🙂
washingtonpost.com
And, to top it all off, my very first project at I worked on at the Post: Explore Nationals Park. This project incorporated video, panoramic images and a stadium rendering that we got from the firm that worked on the stadium, HOK Sport. I designed it and put together the dynamic version of some of the graphics, and Nelson Hsu put it all together. It was a great experience to work on something like this when I first arrived and Nelson was a great person to learn from.
washingtonpost.com
I also plan to (finally) post some pictures from India and some stories about the trip.
SPEEDING TICKETS BY JURISDICTION 2006 This map shows the distribution of speeding tickets in Maryland by range of miles-per-hour over the limit. The pattern varies county-by-county.
BRAC SECTION FRONT In preparation for the influx of military workers coming to Maryland during the upcoming base realignment, we wanted to prepare a page that explained the process, informed readers of current developments and provided resources for those moving to the area. I designed the BRAC page and the flash graphic in the center of the page, which includes a map of affected bases, quotes from area officials and a timeline of BRAC events. I used archived articles to write all the text for the map portion.
FEATURED COVERAGE SECTION FRONT A section for special coverage was created during a site redesign in the summer of 2007 and I was assigned to create a page that incorporated unique, compelling stories, in-depth and continuous coverage, multimedia, including photography, audio and interactive, and regular features.
HOME SALES MAP Using home sales data compiled by a real estate reporter, I created one of two maps that analyzed year-over-year price changes by zip code.
TIMELINE: ART MODELL This timeline about the life of Art Modell was created to top a gallery of stories about the former Ravens owner. It was one of several timelines that were created using a timeline template that I created in Flash.
RAVENS FOOTBALL CARDS I designed this new take on traditional football cards as a fun way to let Ravens fans check up on their favorite players.
HURRICANE AGNES: 35 YEARS LATER In preparation for hurricane season, I suggested a retrospective about the impact of past hurricanes in Maryland. My supervisor suggested an anniversary piece about Hurricane Agnes. The photo desk provided archived photos and I went to Ellicott City to photograph locations that were seen in the archived images. Then I created this piece about the event.
ORIOLES OPENING DAY VIDEO I shot and edited this video about fans attending the season opener at Camden Yards.


![[Politics of the Prize]](http://2.bp.blogspot.com/_1NI9wgirUFw/StC6eqXdCwI/AAAAAAAAAIY/uUAABKBskZc/s400/Picture+1.png)


![[In the Moment]](http://3.bp.blogspot.com/_1NI9wgirUFw/Spp6yKwuoFI/AAAAAAAAAE0/1fE5fVHmbWw/s400/in-the-moment.jpg)


